
Figure 2.
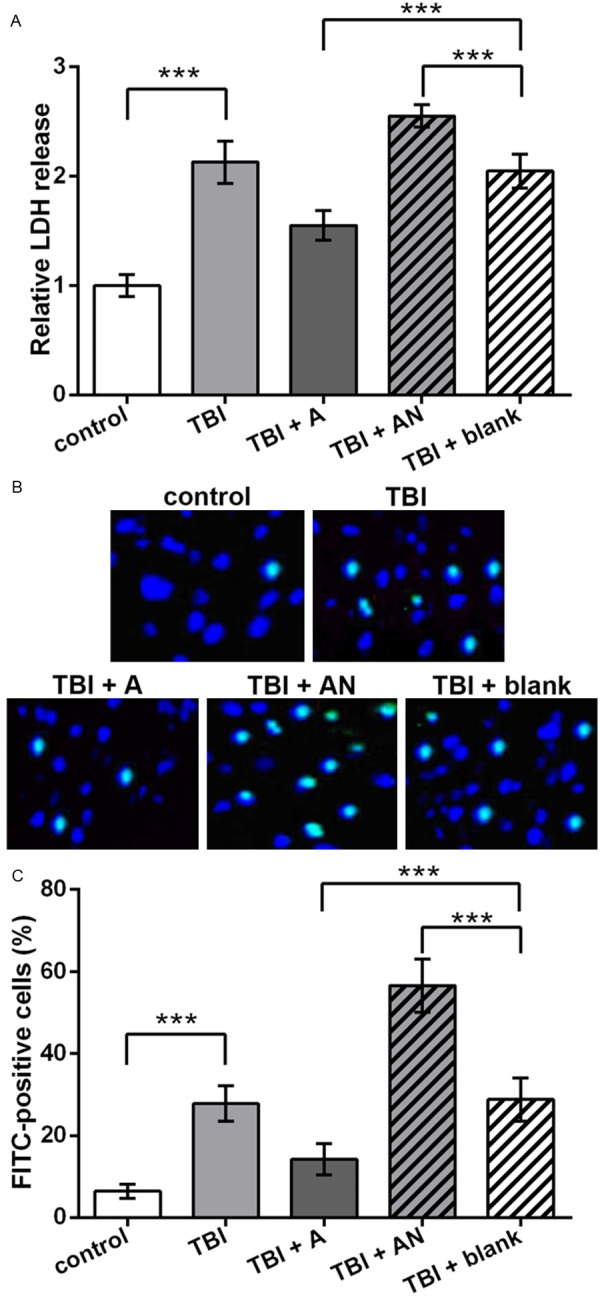
Neuronal cell injury and apoptosis promoted by TBI and inhibited by miR-22. control, cells without treatment. TBI, TBI cell model. TBI + A, cells transfected with miR-22 agomir and injured by scratches. TBI + AN, cells transfected with miR-22 antagomir and injured by scratches. TBI + blank, transfection control cells injured by scratches. A. Relative LDH release in the culture medium which indicates cell injury. B. Pictures of TUNEL assay indicating apoptotic neuronal cells (bright blue). C. Histogram of the average percent of apoptotic neuronal cells (FITC-positive) in each group. **P < 0.01. ***P < 0.001. LDH, lactate dehydrogenase. TUNEL, TdT-mediated dUTP nick-end labeling. FITC, fluorescein isothiocyanate.