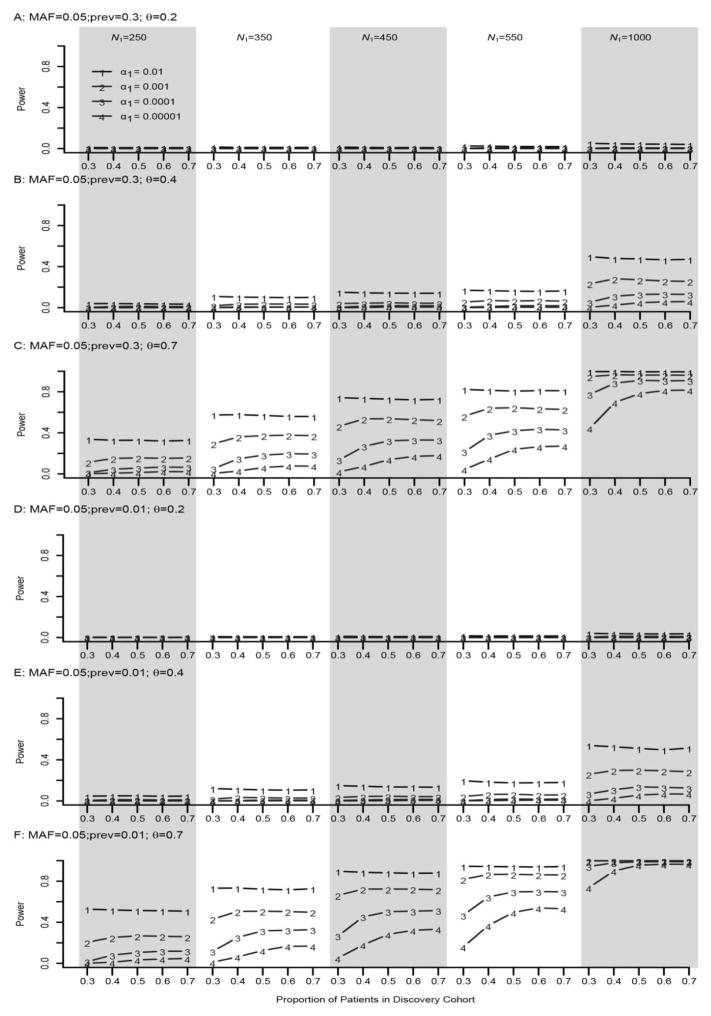
Figure 3. Empirical power of TSIR for detecting a SNP with a MAF of 0.05 for a binary phenotype.
A, B and C are for small effect size θ = 0.2, moderate effect size 0.4, and large effect size 0.7 for a large prevalence of 0.3, respectively. D, E and F are for small effect size θ = 0.2, moderate effect size 0.4, and large effect size 0.7 for a small prevalence of 0.01, respectively. The solid lines with the numbers of 1–4 correspond to α1 = 0.01, 0.001, 0.0001, and 0.00001, respectively.

