
Fig. 2.
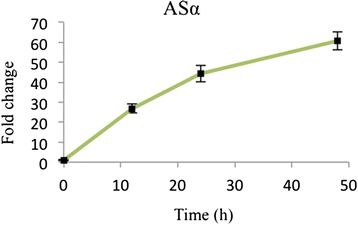
Fold change of transcript levels of ASα in the induced transgenic C. roseus hairy roots compared to the uninduced control at 12, 24 and 48 h. Data represents the mean of triplicate ± standard deviation.
Official websites use .gov
A
.gov website belongs to an official
government organization in the United States.
Secure .gov websites use HTTPS
A lock (
) or https:// means you've safely
connected to the .gov website. Share sensitive
information only on official, secure websites.
Fold change of transcript levels of ASα in the induced transgenic C. roseus hairy roots compared to the uninduced control at 12, 24 and 48 h. Data represents the mean of triplicate ± standard deviation.