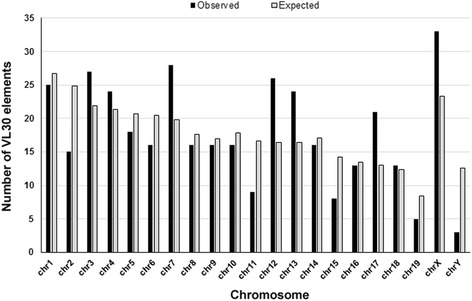
Fig. 3.

Mouse genomic distribution of VL30 elements. Histogram bars indicate the observed (black) and expected (light grey) number of VL30 elements from each mouse chromosome. The expected number of VL30 elements on each chromosome was calculated following multiplication of the chromosomal length with average density of VL30s in the mouse genome
