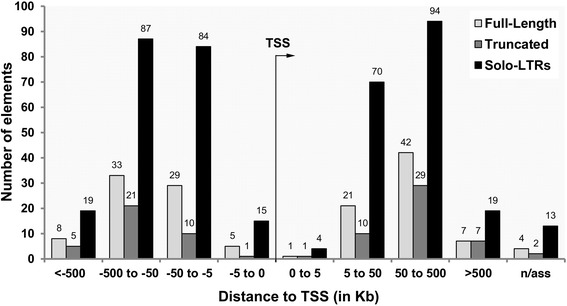
Fig. 5.

Distribution of VL30s relative to transcription start sites of mouse genes. Analysis with GREAT tool under default settings was performed for full-length, truncated VL30s and solo LTRs. The chart shows the relative distance (0–5, 5–50, 50–500, 500–1000 Kb) of full-length (light grey), truncated (dark grey) or solo LTRs (black) to Transcription Start Site (TSS). n/ass denotes VL30s not associated to any genes
