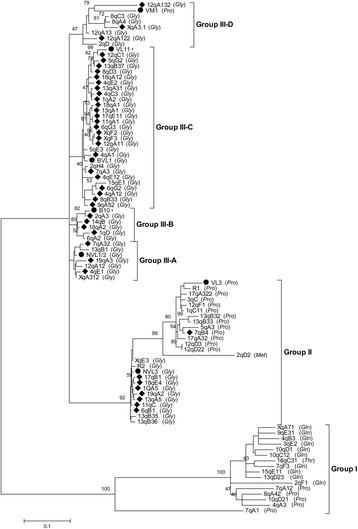
Fig. 6.

Molecular phylogenetic analysis of full-length VL30 LTRs by the Maximum Likelihood method. The bootstrap consensus tree representing the phylogeny of LTRs from 86 full-length and 6 known VL30s is presented (500 tests). The percentage of replicate trees in which the associated taxa clustered together is shown above the branches. The tree is drawn to scale, with branch lengths measured in the number of substitutions per site. Bootstrap replicates denote known elements or elements with identical 5′ and 3′ LTRs. The respective tRNA species used by each VL30 element is shown in parenthesis. Asterisk denotes solo LTR sequences
