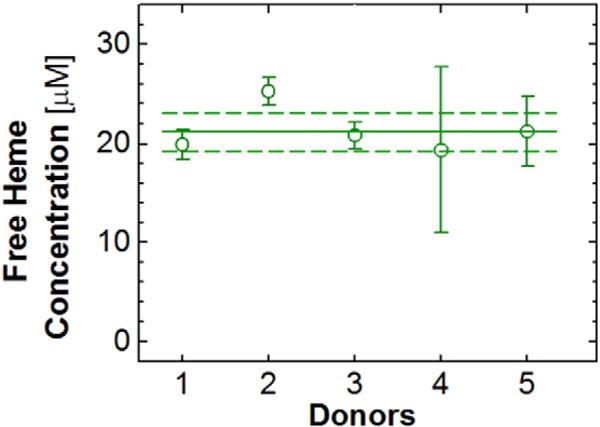
Fig. 3.

The average concentrations of free heme in blood samples of five healthy donors. Eight donations of four 4 mL tubes were obtained from donor 1 and two from donor 2 and are averaged; all other data points are averages over four tubes of a single donation. The population average, 21 μM, is marked with a horizontal solid line; the standard deviation, 2 μM, with two dashed lines.
