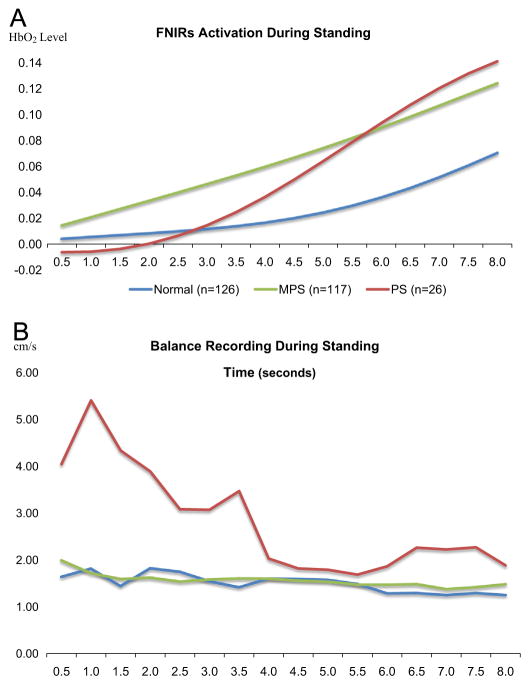
Fig. 1.
(A) Averaged oxygenated hemoglobin (HbO2) levels across 16 consecutive seconds for normal controls (blue trace), individuals with MPS (green trace), and individuals with PS (red trace). (B) Averaged COP velocity across 16 consecutive seconds for normal controls (blue trace), individuals with MPS (green trace), and individuals with PS (red trace). (For interpretation of the references to color in this figure legend, the reader is referred to the web version of this article.)

