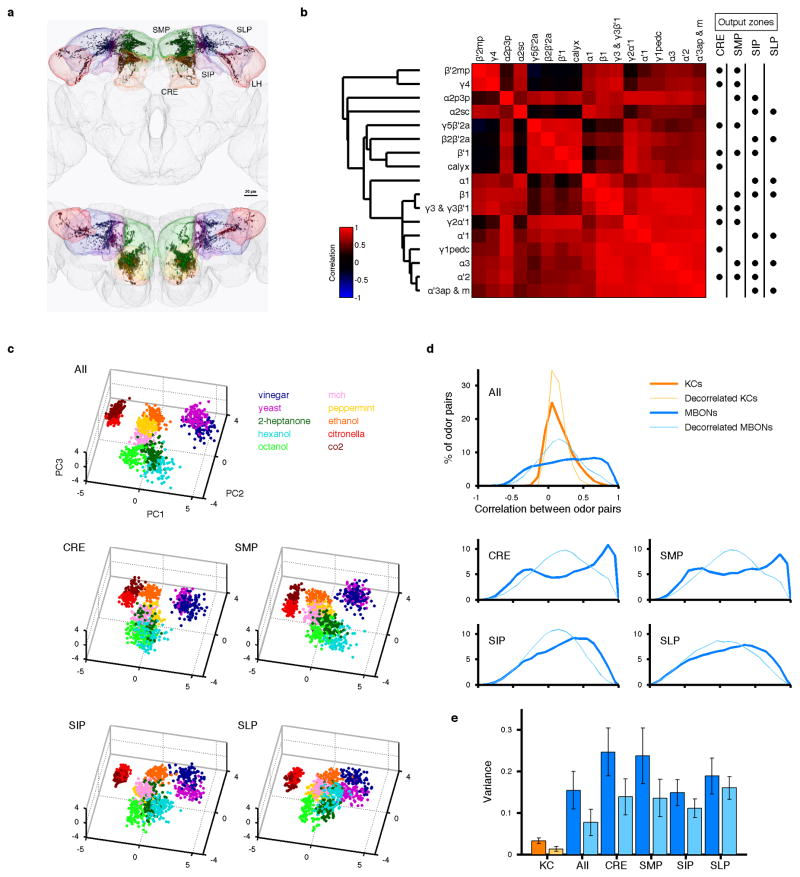
Extended Data Figure 5. Population analysis of subpopulations of MBONs.
a, Distribution of MBON terminals in the brain (dark colors), based on the localization of a presynaptic marker8 (Syt::smGFP-HA). Anterior (top) and dorsal (bottom) views are shown. Axonal projections of MBONs converge heavily onto small areas inside four neighboring neuropils (light colors), crepine (CRE; orange), superior medial protocerebrum (SMP; green), superior intermediate protocerebrum (SIP; purple) and superior lateral protocerebrum (SLP; blue). We have found numerous cells that send widely branching neurites into one or all of these areas (database associated with ref. 45), indicating that downstream neurons likely read out activity from populations of MBONs. Lateral horn (LH, red) also receives sparse input. b, Pairwise correlations of MBON tuning patterns and the corresponding dendrogram are shown in the same way as Fig. 1d. The dots on the right show the axonal projection site of the different MBON types. None of the four major projection zones samples from particularly decorrelated set of MBONs. c, Odor representations in MBONs from a single virtual fly visualized by PCA (different virtual fly from Fig. 2c). Representations from the full MBON population (All) and subpopulations with the same axonal projection zones (CRE, SMP, SIP and SLP) are shown. Representations by subpopulations tend to be noisier than those from the full population, but they retain grossly similar structures. d, Correlation coefficients of neural representations of ten odors in KCs and MBONs (thick lines), as in Fig. 2g and h. Correlation values observed after artificially decorrelating KC and MBON tuning curves are shown for comparison (thin lines). e, Variance of the correlation coefficients shown in d (dark bars; mean ± SD; n = 1000 virtual flies), showing that values are more widely distributed in MBONs compared to KCs. Artificially decorrelating MBON tuning curves reduces the variance considerably (light bars), indicating that the pattern of activity in the MBONs contributes to the high variance. However, variance remains greater than that in the KCs, indicating that the breadth of tuning in the MBONs also contributes to wide range of correlation coefficients. The ratio of the contribution of those two factors seems to be different across subpopulations projecting different zones.

