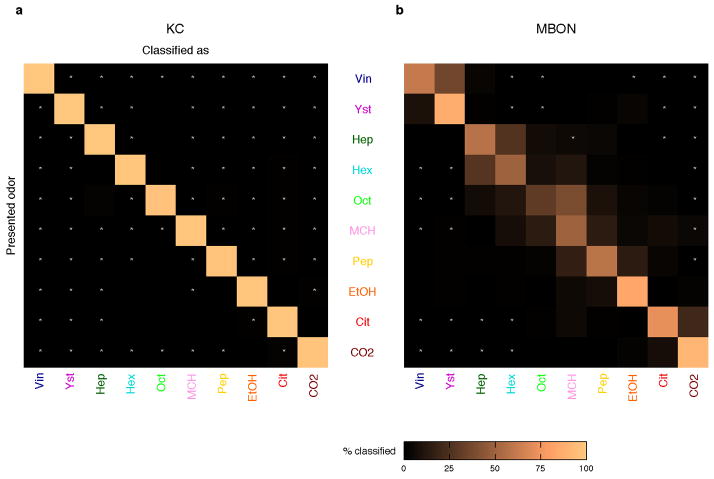
Extended Data Figure 7. Confusion matrices from odor classification analysis. Confusion matrices generated from the classification analysis in Fig. 2d.
a, KCs show nearly perfect classification performance. b, MBONs fail to discriminate some odors. Although the confusion matrix was generated using 100 different virtual flies (see Methods), a high rate of misclassifications is observed only between certain odor pairs that form overlapping clouds in MBON space (Fig. 2c). Odor pairs that were never misclassified with each other are indicated with white asterisks. Note that the group of vinegar and yeast were never misclassified with the group of CO2 and citronella.

