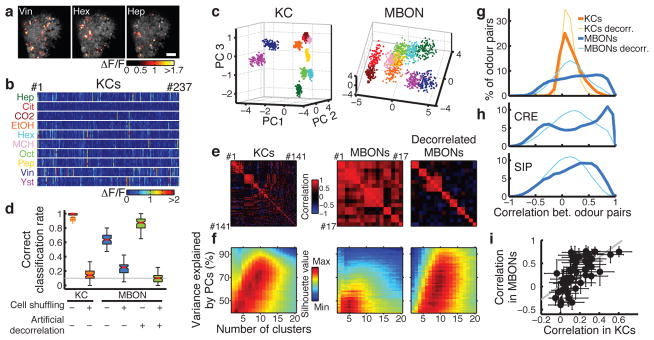
Figure 2. Transformation of population representations from KCs to MBONs.
a, Representative odor responses of KC somata in a single fly with pseudo-colored ΔF/F images overlaid on grayscale basal fluorescence. Scale bar, 20 μm. b, Summary of responses from the fly in a. Columns, KCs. Rows, trials sorted by odors. c, Odor representations in single representative fly (KCs, same fly as a) or virtual fly (MBONs) projected onto the first three principal component axes (100 data points per odor; see Methods). Colors indicate odors as in b. d, Accuracy of odor classification (100 classification scores for both KCs and MBONs; see Methods). Red lines indicate medians, boxes interquartile ranges, notches 95% confidence intervals, whiskers data ranges, and crosses outliers. Gray line, chance level. e, Correlation matrices of tuning curves. Data are from a single representative fly (KCs) or virtual fly (MBONs). f, Clustering analysis of population activity patterns in KCs and MBONs (KCs: n = 10 flies, MBONs: n = 20 virtual flies; see Methods). Highest silhouette values indicate optimal clustering. Silhouette value ranges are, KCs: 0.37–0.84, MBONs: 0.35–0.74, decorrelated MBONs: 0.27–0.65 g, Correlation coefficients (Pearson’s r) of neural representations of ten odors (45 odor pairs), calculated using the response patterns averaged across trials in KCs (n = 10 flies, orange) and MBONs (n = 1000 virtual flies, blue). Mean distributions are shown. Distributions of artificially decorrelated data are in lighter colors. h, Same as g, but for MBON subpopulations with axonal projections to different areas. See also Extended Data Fig. 5. i, Correlation coefficients in KCs and MBONs are positively correlated. Each dot corresponds to correlation coefficient of a specific odor pair (mean ± SD). Gray line, linear regression (R2 = 0.42, p < 10−5).

