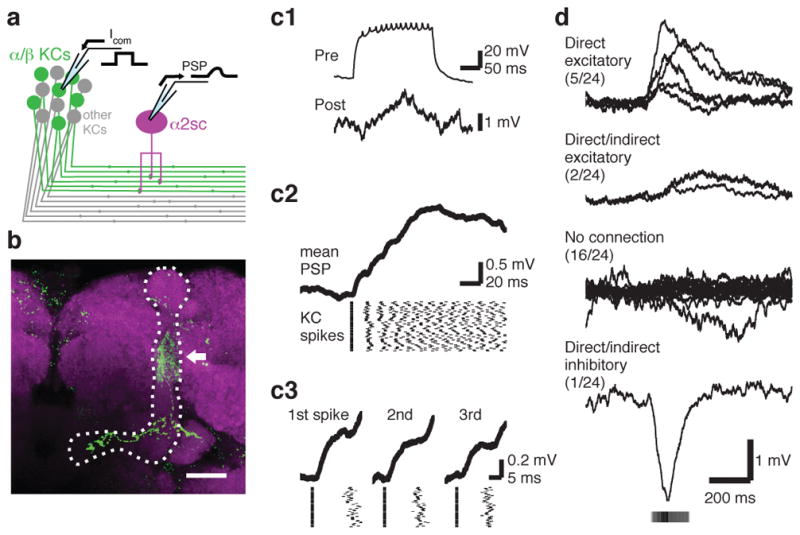
Figure 4. Connection probability between KCs and a MBON.

a, Schematic of paired whole-cell recording. b, Post hoc immunohistochemistry of biocytin infused via whole-cell electrodes (green, maximum intensity projection). Axon of α/βKC, extending within α/βlobes (dotted line), and dendritic arbor of α2sc neuron (arrow) are visible. Magenta, anti-nc82 antibody. Scale bar, 20 μm. c, A directly connected KC-α2sc neuron pair. (c1) A train of KC spikes (Pre) and the evoked response in a α2sc neuron (Post) recorded simultaneously. (c2) Discrete EPSP steps visualized by spike-trigger-averaging MBON membrane potential on the first KC spike of each trial. (c3) Enlarged spike-trigger-averaged EPSPs for the first, second and third spikes in the train reveal a short synaptic delay (< 2 ms). d, The four categories of synaptic connectivity (see Methods). The first-spike-trigger-averaged responses for all pairs in each category are overlaid. Timing of the KC spikes is indicated by grayscale bar, whose intensity shows the mean relative spike rate.
