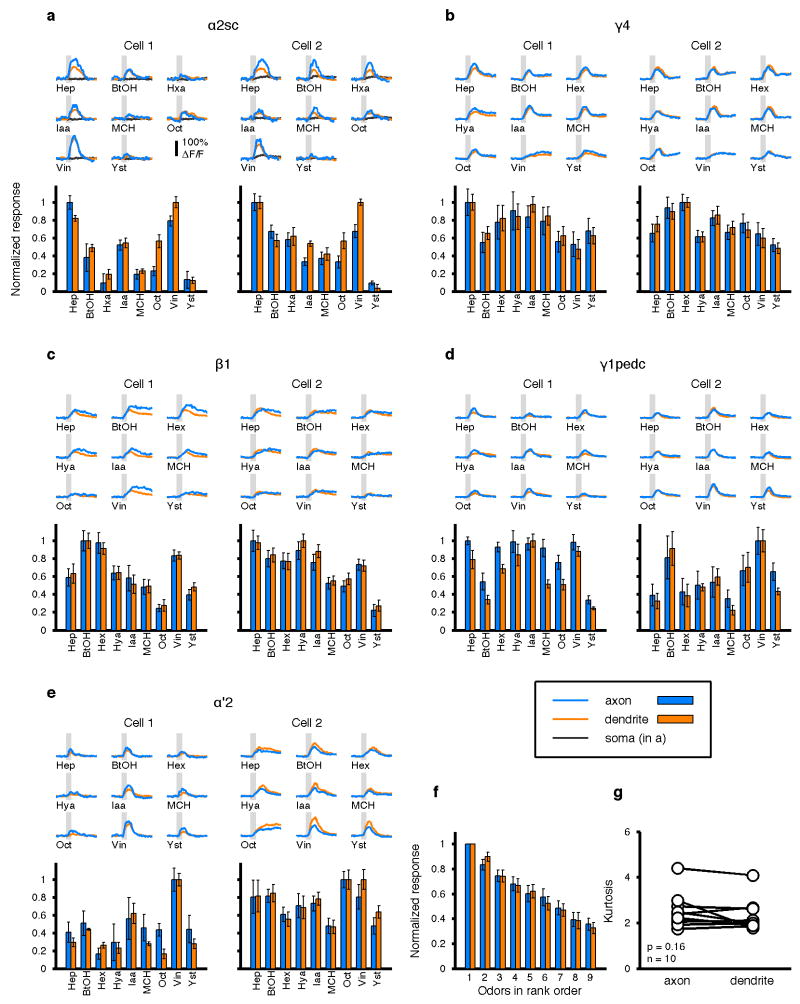
Extended Data Figure 1. Comparison of odor-evoked calcium responses across multiple cell compartments.
a, Odor responses were sequentially recorded at three different compartments (axon, blue; dendrite, orange and soma, black) in two different α2sc neurons with GCaMP5 imaging. Upper subpanel shows mean ΔF/F traces from different compartments (4 or 5 trials for each). Shaded areas indicate 1-s odor stimulations. Lower subpanel shows tuning profiles in axon and dendrites (normalized to the strongest response, mean ± SEM). Note that the time course, response magnitude and tuning profiles are largely consistent between the axon and dendrite in the same cell, while signals at the soma are small and slower (Cell2) or sometimes undetectable (Cell1). b–e, Data from 4 other types of MBONs. Scale of the traces is the same as a. Correlation between axons and dendrites is 0.92 ± 0.013 (Pearson’s r, mean ± SEM; n = 10 cells). f, Mean normalized tuning of the ten cells. Odors are sorted according to the rank order in each cell to visualize the tuning width. g, Kurtosis of tuning curves. There was no difference between axons and dendrites (p = 0.16, paired t-test).

