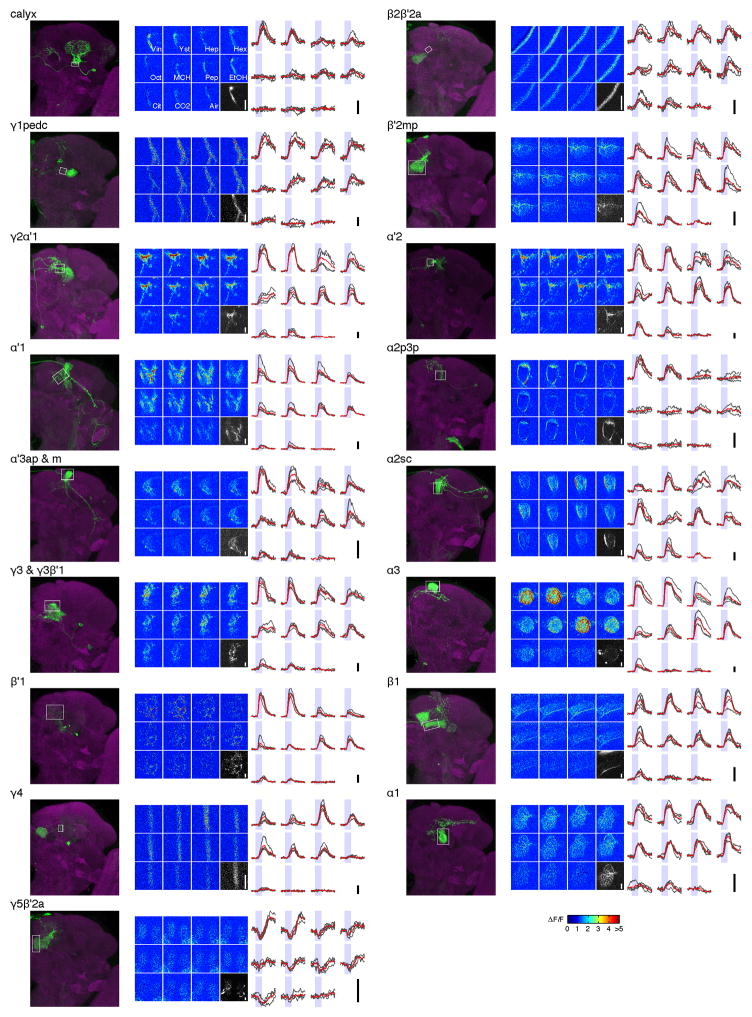
Extended Data Figure 2. Raw traces of calcium imaging in MBONs.
For all 17 types/combination of types of MBONs, we show a projection image of confocal stacks from split- GAL4 lines (left), example ΔF/F images of the calcium responses to ten odors and air (middle) and ΔF/F time courses (right). Note that all the split-GAL4 lines used in this study label the target MBONs with extremely high specificity. The white squares indicate the approximate region scanned during calcium imaging. Grayscale images show baseline fluorescence (scale bar, 5 μm), while colormap images represent calcium responses (ΔF/F, color scale bottom right). Traces showing ΔF/F time courses on individual trials (gray; n = 4–7) are overlaid with the mean (red), scale bar, 50% ΔF/F.

