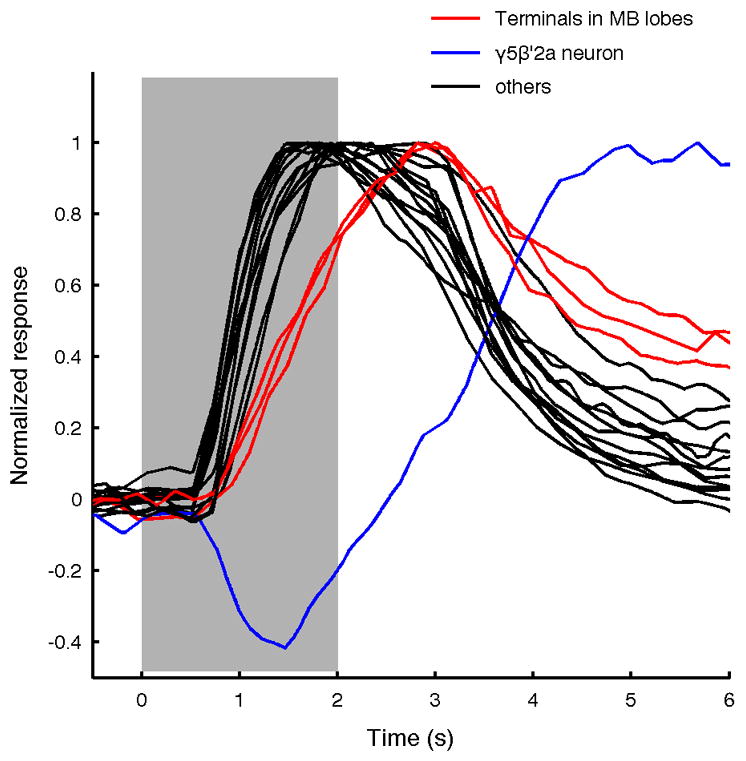
Extended Data Figure 4. Diversity in response time courses across the MBON population.

Normalized mean ΔF/F responses to yeast odor for all MBON types overlaid (shading indicates timing of odor presentation). Note that three MBONs (β1, γ1pedc, and γ4) that have axonal terminals in the MB lobes show slower time courses (red) than the others (black). The cell with the characteristic inhibitory period is the γ5β′2a neuron (blue).
