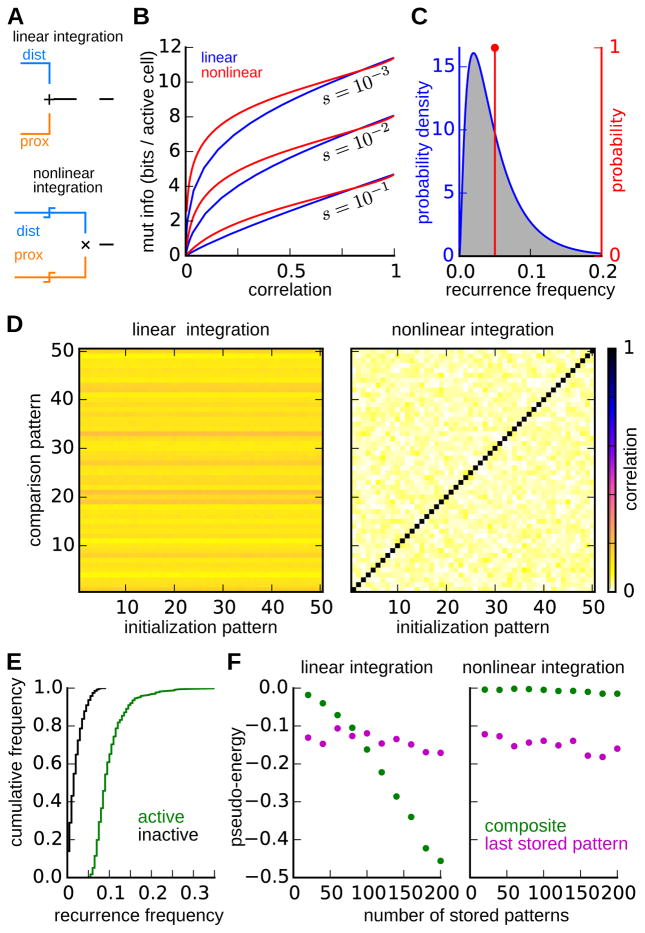
Figure 5. Comparison of linear and nonlinear integration of distal and proximal inputs.
(A) Schematic diagrams of contrasting input integration schemes. For linear integration (top), distal and proximal inputs are summed before thresholding is applied. For nonlinear integration (bottom), the proximal and distal inputs are each thresholded separately, with an AND operation applied to the output of these threshold operations.
(B) Trade-off between engram decorrelation and information. Parametric curves show the relationship between the correlation between engrams for pairs of highly similar memories, and the mutual information that an engram contains about the distal input pattern at the time of encoding. Separate curves correspond to networks with linear (blue) and nonlinear (red) integration for three different levels of engram sparsity.
(C) Distribution of recurrence frequency – i.e. the fraction of highly similar engrams in which a neuron is active – for neurons in engrams of networks with linear (blue) and nonlinear (red) integration.
(D) Evaluation of engram attractors following the storage of 200 similar (i.e. same distal inputs) memories. The plots show the correlation between the 50 most recently stored engrams (comparison patterns, ordered with most recent first) and the activity state to which the recall dynamics converge when the network is initialized with each of these same engrams (initialization patterns). The network with linear input integration (left) converges into a common attractor independent of the initialization. The correlation of this common attractor with each of the engrams determines the horizontal banding pattern. The network with nonlinear integration (right) maintains distinct attractors for each pattern, as indicated by the high correlations along the diagonal. The two networks were matched with regard to both sparsity and the pairwise correlation between similar engrams.
(E) The recurrence frequency distributions for neurons that are active (red) or inactive (black) in the composite attractor of the linear integration network in (D). The composite attractor consists of the neurons that have been active is the highest fraction of stored patterns.
(F) Pseudo-energies of the most recently stored engram and the composite activity pattern following storage of progressively many similar patterns. In the network with linear integration (left), but not in the network with nonlinear integration (right), the pseudo-energy of the composite pattern falls below that of the most similar stored pattern.

