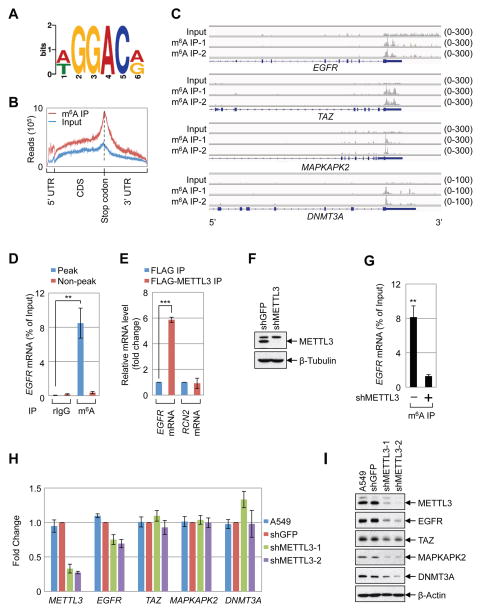
Figure 1. METTL3 regulates protein expression.
(A–B) Global profiling of m6A in A549 cells. (A) Sequence motif identified from the top 1000 m6A peaks. (B) Distribution of m6A peaks across all mRNAs. (C) Integrative Genomics Viewer (IGV) plots of m6A peaks at individual mRNAs. The y-axis shows sequence read number, blue boxes represent exons, and blue lines represents introns. (D) q.RT-PCR analysis of α-m6A IP in A549 cells using indicated PCR primers. (E) q.RT-PCR analysis of FLAG-METTL3 RNA IP in A549 cells with indicated primers. (F) Western blot with indicated antibodies. (G) q.RT-PCR analysis of EGFR m6A levels upon depletion of METTL3 in A549 cells. (H, I) Expression of METTL3 and m6A targets in the METTL3 knockdown cells. (H) q.RT-PCR analysis of indicated mRNA levels. mRNA was first normalized to β-Actin mRNA. Relative ratio (fold-change) obtained in the presence of shGFP was set to 1. (I) Western blotting with indicated antibodies. All q.RT-PCR data are presented as ±SEM. n=3. **p<0.01, ***p<0.001. See also Figures S1 and S2, and Supplementary Table 1.

