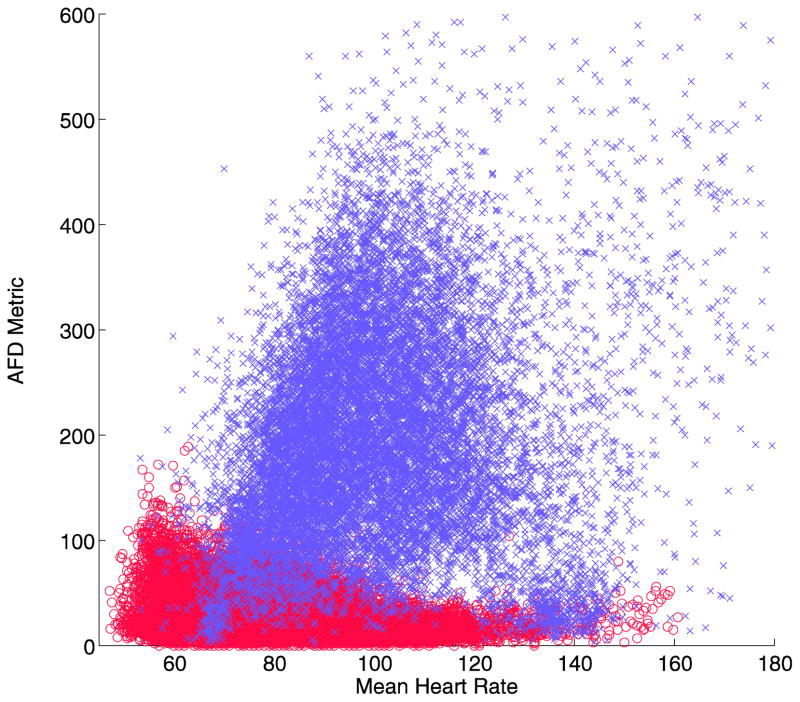
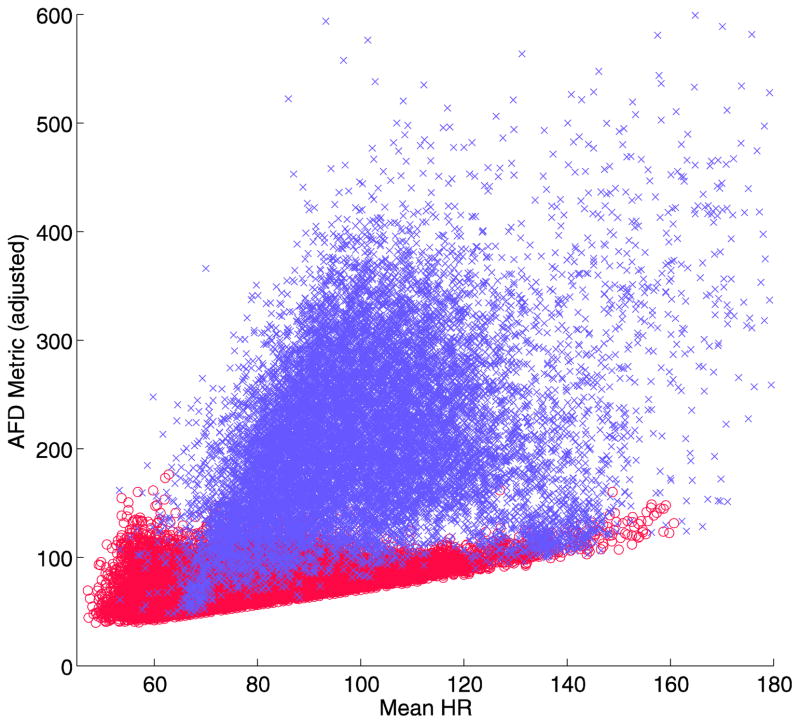
Fig 2.
Plot of the AFD metric versus mean heart rate per analysis segment for normal sinus rhythm (o, red) and atrial fibrillation (x, lilac) in the development data set. A linear relationship is evident for the normal sinus rhythm (a), which can be adjusted linearly (b), allowing a more accurate discrimination threshold of the resulting value


