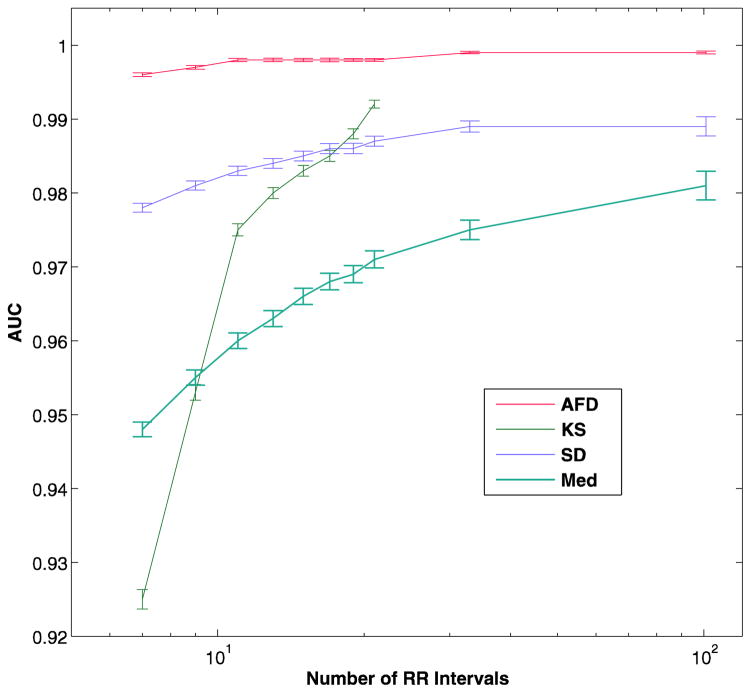
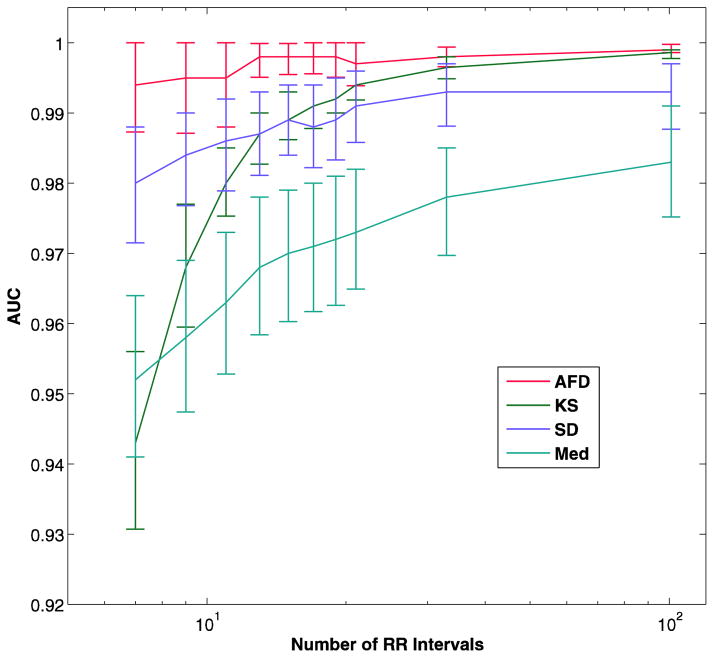
Fig 3.
AUC versus number of RR intervals in analysis segment in the test data set (a). The bars represent the 95% confidence intervals. The number of RR intervals is on a log scale. The panel b shows the mean AUC with 25-fold cross-validation, which allowed calculation of the KS method for large analysis segments. AFD - the current algorithm, KS - Kolmogorov-Smirnov test of the histogram of differences in RR interval, SD - standard deviation of RR intervals, Med - Median difference of the RR intervals


