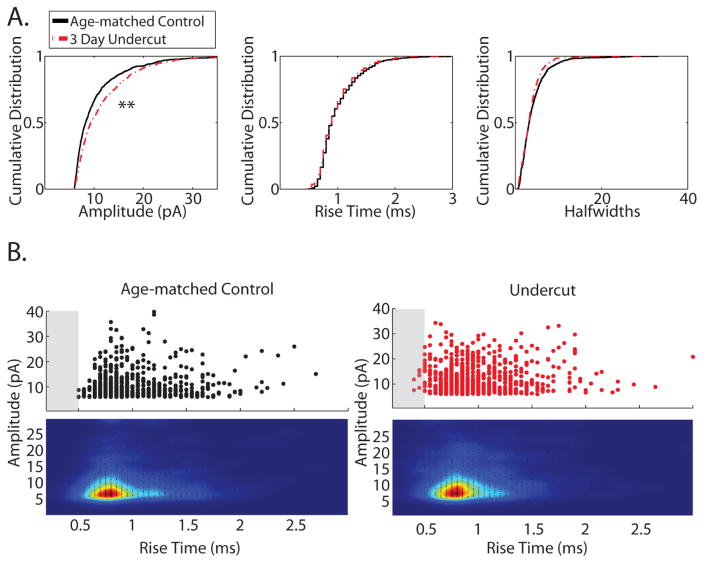
Figure 6.
Miniature (m) EPSC kinetics and amplitudes in slices from control and UC cortex. A. Cumulative distributions of peak amplitudes (left), 10–90 rise times (middle), and half widths (right) of mEPSCs recorded in the presence of 1 μM TTX from layer V pyramidal neurons in control (n = 10, black solid line) and UC (n = 11, red dashed line) slices. Peak amplitudes were larger in UC slices (d = 0.13, **P < 0.001), while rise times and half widths were not statistically different. B. Scatter plot and cloud density analysis of mEPSC amplitude vs. rise time from control (left) and UC (right) slices. Shaded boxes from 0 ms to 0.5 ms highlight a population of mEPSCs with fast rise times and larger amplitudes from UC slices not present in control slices

