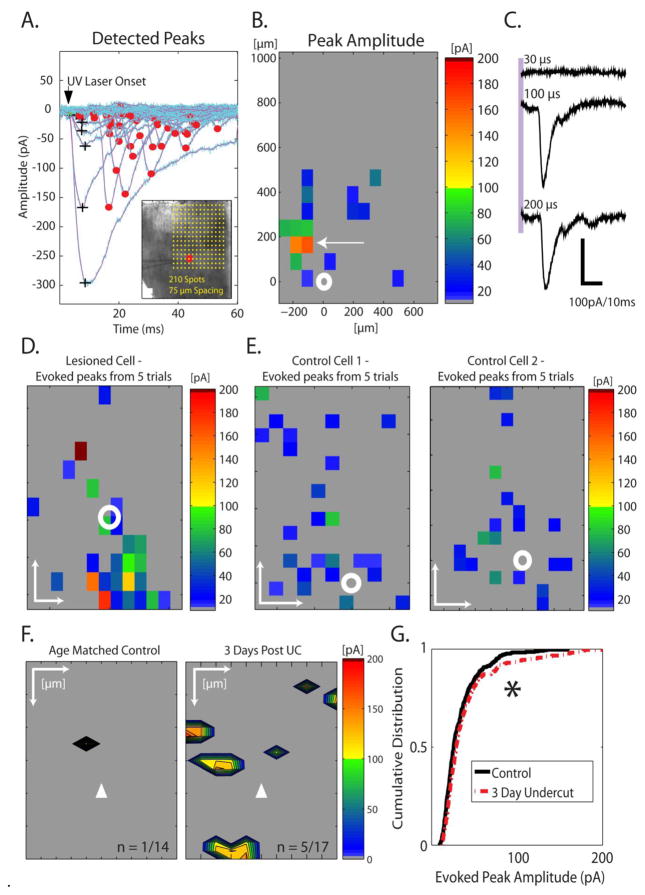
Figure 8.
Focal glutamate uncaging evokes large amplitude EPSCs after UC. A. LSPS-evoked currents were segregated as either direct responses (black +) that resulted from glutamate uncaged onto the neuron being recorded, or putative monosynaptic events (red circles on peaks) from synaptically connected presynaptic neuron(s) depolarized to threshold by glutamate uncaging. The various latencies of monosynaptic EPSCs presumably represent variable latency to reach threshold in stimulated presynaptic neurons. Inset: DIC image of recorded UC slice from experiment in (A) with respect to laser scanning photostimulation locations. Yellow dots in inset: locations of laser evoked glutamate uncaging. Red circle: position of the recorded cell in layer V of UC neocortex. Pial surface is up here and in B, D–F. B. Single trial heat map that shows the peak amplitude of putative monosynaptic EPSCs recorded in (A) in response to glutamate uncaging at the locations shown in inset of (A). White circle: location of recorded cell in layer V; white arrow: one location from which a single large amplitude EPSC was evoked. C. The large amplitude EPSC evoked from the location indicated by arrow in (B) appeared to be all-or-none as it was triggered abruptly at threshold and its amplitude and latency were insensitive to doubling of the duration of the laser pulse (laser onset indicated by purple vertical bar). Similar all-or-none EPSCs were elicited in 4 neurons where they could be repeatedly evoked by laser flashes. D. Heat map constructed from averaging 5 trials from a Pyr cell in a different UC slice. Note the amplitude scale and the evoked monosynaptic EPSCs with peak amplitudes >100 pA. E. Two examples of averaged maps from control cells (5 maps from each cell). In D and E, white scale bars: 200 μm for both X and Y axes, white circle: location of recorded cell in layer V. Identical heat map scale bars are used in B, D, and E. F. Averaged maps from multiple trials showing the locations from which large amplitude EPSCs (>100 pA) could be evoked in control cortical slices (left map; n = 1 of 14 slices) and UC (right map; n = 5 of 17 slices). EPSCs <75 pA are not shown in these maps. Note the greater number of locations and laminar and columnar distributions from where large amplitude EPSCs were evoked in UC slices. Scale bars: 100 μm for X axis, 200 μm for Y axis. White triangle: location of recorded cell in layer V. G. Cumulative distribution of uncaging-evoked EPSCs from all cells shows a significant shift for larger amplitude EPSCs in UC vs. control slices (*P < 0.5).

