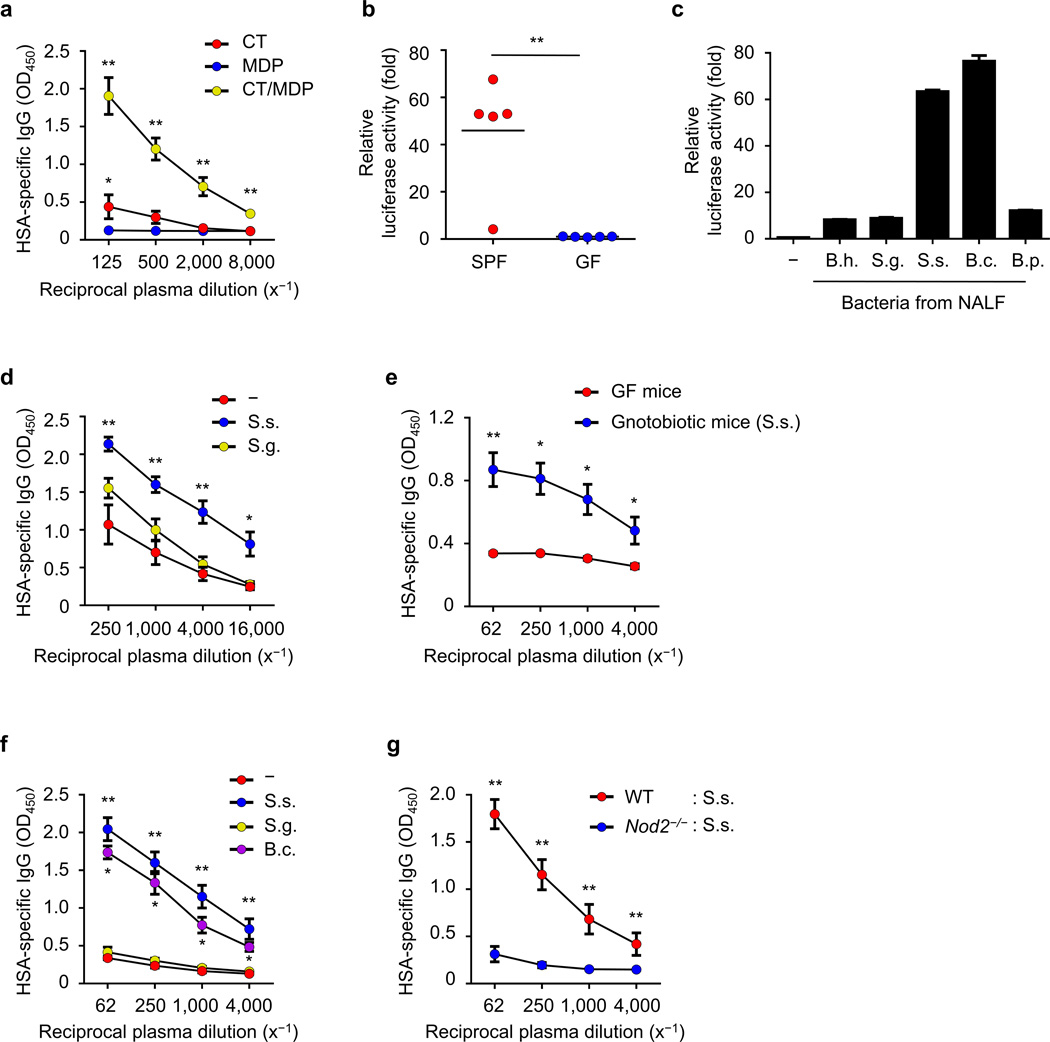
Figure 6. Nod2-stimulatory bacteria promote the adjuvant activity of cholera toxin.
(a) Relative levels of HSA-specific IgG in plasma of GF mice (each group n = 5) intranasally immunized with indicated stimuli in the presence HSA on day 14 post-immunization. (b) Nod2-stimulatory activity in NALF from SPF or GF mice. Each dot represents an individual mouse and the mean value is displayed by a line (c) Nod2-stimulatory activity in indicated bacteria isolated from NALF. B. h., Bordetella hinzii; S. g., Staphylococcus gallinarum; S. s., Staphylococcus sciuri; B. c., Bacillus clausii; B. p., Bacillus pumilus. (d–f) Relative amounts of HSA-specific IgG were analyzed in plasma on day 14 post-immunization. (d) SPF mice (each group n = 5) were intranasally immunized with HSA and CT together with live S. sciuri or S. gallinarum. (e) GF (n = 5) and gnotobiotic mice (n = 6) monocolonized with S. sciuri were intranasally given HSA and CT on day 5 after monocolonization. (f) GF mice were intranasally treated with HSA and CT together with UV-inactivated S. sciuri, S. gallinarum, or B. clausii. (g) The relative levels of HSA-specific IgG were examined in plasma on day 14 post-immunization of WT GF (n = 5) and Nod2−/− GF (n = 6) mice given UV-inactivated S. sciuri, HSA, and CT. Data represent means ± s.e.m. (a, d–g) or ± s.d. (c). *P < 0.05 and **P < 0.01 by Kruskal-Wallis test with post-hoc Dunn’s test (a, d, f), by Mann-Whitney test (b, g) and by Student’s t-test (c). *P < 0.05 between CT and MDP groups by Mann-Whitney test (a).

