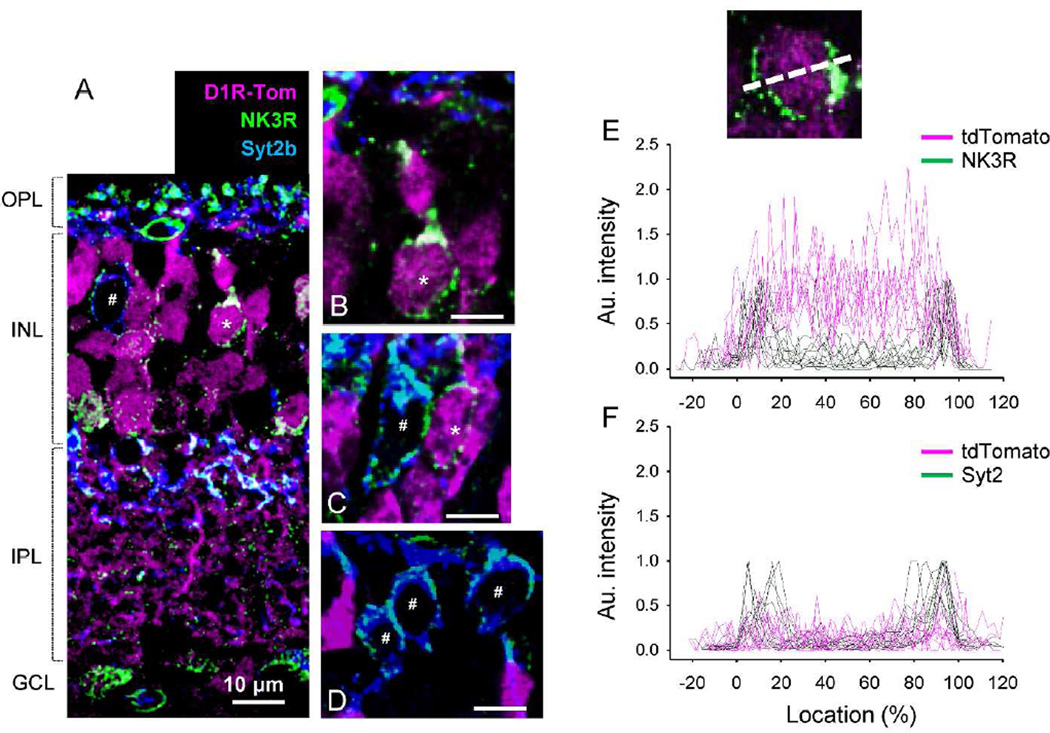
Figure 2.
tdTomato expression in type 1 and 2 OFF bipolar cells. (A) NK3R antibody labeled type 1 and 2 OFF bipolar cells. Type 1 cells, identified with NK3R but not Syt2b antibodies, were colocalized with tdTomato (*). Type 2 cells were labeled with both NK3R and Syt2b, but were negative for tdTomato (#). (B) A magnified view of a type 1 cell soma. All magnified views in this and subsequent figures are excised from single digital section images (0.3–0.5 µm thickness). (C) Somas of type 1 and type 2 cells. Only the type 1 cell colocalized with tdTomato. (D) Three somas of type 2 cells showed no colocalization with tdTomato fluorescence. Scale bars indicate 10 µm. (E) Fluorescent intensities of tdTomato and bipolar cell markers were measured across somas (inset) (n=8) as described in the Methods. For type 1 bipolar cells, NK3R labeled the cellular edges while tdTomato fluorescence was observed across the entire soma. Some type 1 cells were not labeled with tdTomato. (F) Fluorescent intensity measurement showed that type 2 cell somas did not colocalize with tdTomato (n=10).

