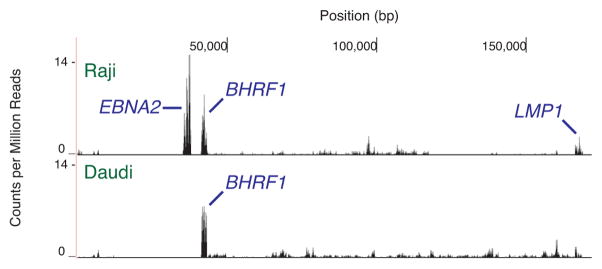
Fig. 1.
Deep sequencing of EBV transcription in Raji and Daudi cell lines. The X axis denotes nucleotide position and the Y axis denotes the number of counts per million mapped reads. RNA signals with unambiguously assignable annotations are marked. BHRF1 and the BARTs are latent transcripts labeled blue. One representative transcriptome from independent replicates is shown.

