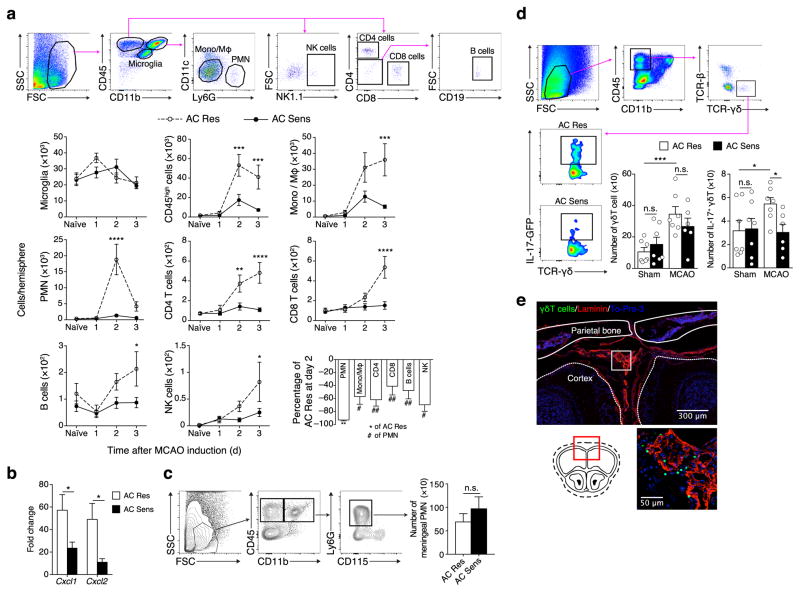
Figure 3.
Accumulation of IL-17+ γδ T cells at the meninges is associated with increased infarct size. (a) Flow cytometric gating strategy of brain microglia (CD45intCD11bint) and infiltrating leukocytes (CD45high) including monocytes/macrophages (Mono/MΦ; CD11b+Ly6G−CD11c−), neutrophils (PMN; CD11b+Ly6G+CD11c−), CD4+ T cells (CD11b−CD4+CD8−), CD8+ T cells (CD11b−CD8+CD4−), B cells (CD11b−CD4−CD8−CD19+) and natural killer cells (NK; CD11b−NK1.1+) in AC Res and AC Sens naïve mice and days 1, 2 and 3 after MCAO. Graphs represent absolute number of cells in the ischemic hemisphere (n = 5–9 per group, Supplementary Table 3). Bottom right graph, percentage of leukocyte reduction 2 days after reperfusion (n = 8–9 per group, Supplementary Table 3). Values are mean ± s.e.m. **P < 0.01 versus AC Res; #P < 0.05 and ##P < 0.01 versus neutrophils (Student’s t-test). (b) Cxcl1 and Cxcl2 mRNA expression in brains of AC Res and AC Sens mice 1 d after MCAO (n = 10 per group). Values are fold change over brain from naïve mice. (c) Flow cytometric gating strategy of meningeal PMN in AC Res and AC Sens mice 1 d after MCAO. Graph represents PMN cell number quantification in the meninges (n = 9 per group). (d) Flow cytometry analysis of meningeal IL-17+ γδ T cells (CD45highCD11b−TCR-β−TCR-γδ+IL-17+-GFP) of AC Res and AC Sens IL-17-eGFP mice 16 h after MCAO. Left graph represents the total number of γδ T cells and right graph, total number of IL-17+ γδ T cells in the meninges of AC Res and AC Sens mice subjected to sham surgery (n = 7 per group) and after MCAO (AC Res, n = 7; AC Sens, n = 6). Each data point (n) is derived by pooling 2 hemispheres. (e) Representative photomicrographs of meningeal γδ T cells (green; TCR-γδ-GFP+), laminin (red) and cell nuclei (blue, To-Pro-3) 16 h after MCAO. Coronal section is taken at Bregma + 3 mm. Columns and line plots represent mean ± s.e.m. *P < 0.05, **P < 0.01, ***P < 0.001 and ****P < 0.0001; n.s., not significant (Student’s t-test)

