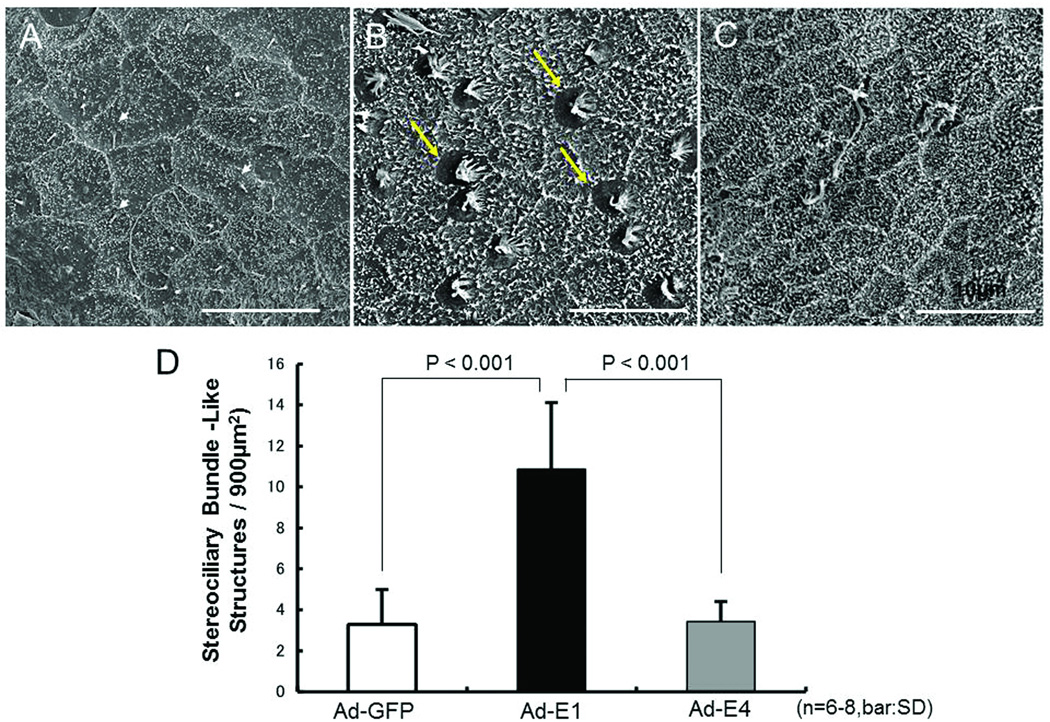
Figure 6.
Scanning electron microscopy (SEM) analysis. A–C: Representative explants. A: Ad-GFP transduction. Reticulated cell borders are observed. Some damaged hair bundles and basal bodies (e.g. arrowheads) remain, but few structures resembling stereocilliary arrays are present. B: Ad-E1 transduced explants. Many apparently immature hair-bundle-like structures are observed (e.g. arrows). C: Ad-E4. Extended microvillus-like structures and microvilli are apparent. There are some damaged streociliary bundles, but few immature hair-bundle-like structures are apparent. D. Quantitative analysis: Number of streociliary bundle-like structures in SEM. Significantly more of these structures are observed on Ad-E1 transduced explants, than on those transduced with Ad-GFP or Ad-E4 (P < .001; 6–8 explants per treatment condition).

