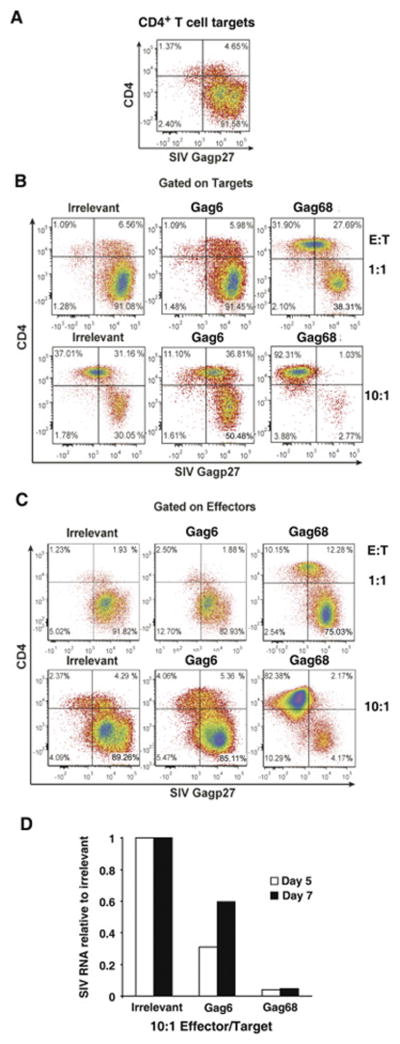
FIG 2.
Gag68 suppression of SIVmac239 infection in CD4+ T cells. (A–C) Flow cytometry for infected CTV-labeled CD4+ T cells by surface CD4 staining and intracellular Gag staining five days post infection: Panel A, analysis of infected rhesus CD4 T-cell targets labeled by CTV is presented. Panel B, analysis of infected rhesus CD4 T-cell targets labeled by CTV co-cultured with irrelevant, Gag6 or Gag68 effector clones at an E:T ratio of 1:1, top row, or 10:1, bottom row, are presented. Panel C, analysis of infected CTV− CD4 effectors in the co-cultures are presented. Analyzed samples are identified above their respective plots with parameters denoted at left and below. Panel D, a graph of real-time RT-PCR results for SIV RNA at days 5 and 7 post co-culture is presented. Viral RNA copies relative to the irrelevant control are presented on the y-axis and the cultures indentified below the x-axis. Data representative of 2 independent experiments.

