
FIG 8.
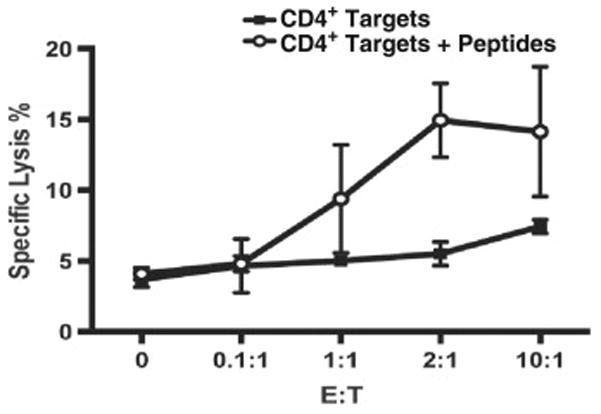
Gag68 cytolysis. Graph of results from CTV/PI flow cytometry analyses of SIVGag(p6-1/2) peptide mix-pulsed target CD4+ T-cell lysis by Gag68 TCR transduced CD4+ T cells is presented. Specific lysis was calculated as the percent of lysed, i.e. CTV+/PI+ cells in the presence of effectors minus the baseline lysis observed in the target cell only control and is presented on the y-axis and with the effector to target ratio (E:T) indicated on the x-axis. Error bars are the standard deviations of two independent triplicate assays.