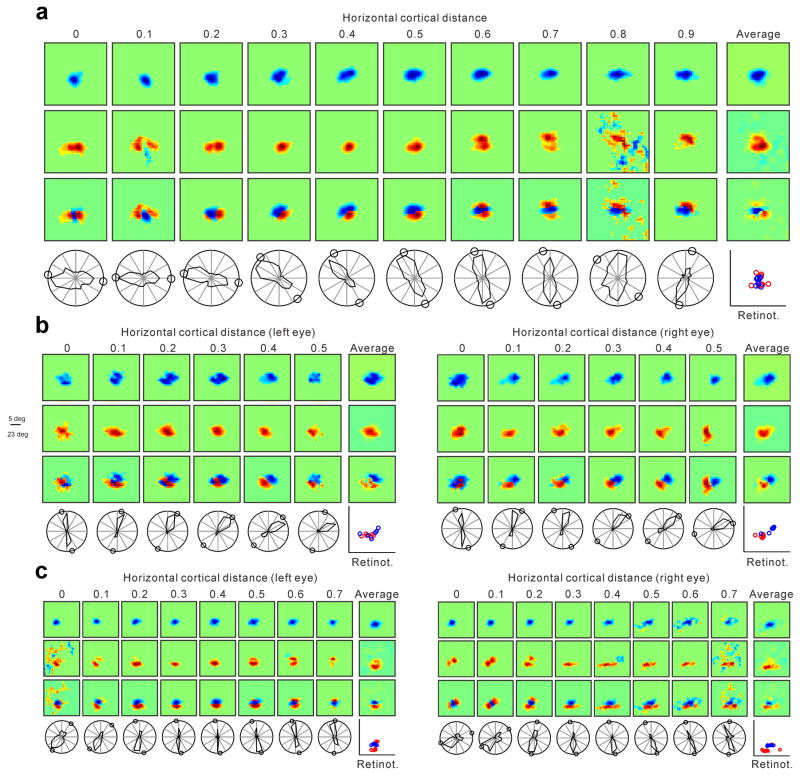
Extended Data Figure 5. Additional examples of horizontal recordings showing a correlation between changes in ON-OFF retinotopy and orientation preference.
a, Horizontal recording through 0.9 mm of cortex. From top to bottom, the first three panel rows show series of OFF, ON and ON-OFF receptive fields (left) and receptive fields averaged across horizontal cortical distance (right). The bottom row shows the orientation/direction tuning (left) and the retinotopy of the strongest response within each receptive field (right, ON: red, OFF, blue). The small circles in the orientation plots illustrate the preferred orientation predicted from the ON-OFF receptive field. b–c, Horizontal recordings through binocular regions of 0.5 mm (b) and 0.7 mm length (c). Notice the accurate binocular match in ON/OFF retinotopy between the two eyes and also the striking binocular similarity in orientation preference, direction preference and orientation/direction selectivity. Each receptive field box has a side of 27 (a), 23 (b) or 23.6 degrees (c).

