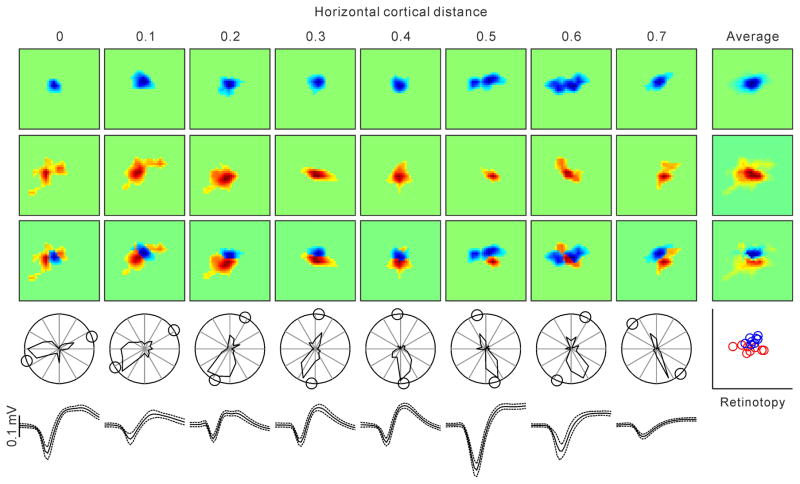
Extended Data Figure 6. Example of a horizontal penetration in which we recorded from several single neurons separated by 0.1 mm distances.
Format is similar to Figure 4a and Extended Data Figure 5a. The only difference is that the receptive fields and orientation plots were obtained from single neurons instead of multiunit activity. The last row shows spike waveforms from each single neuron (average and standard deviation). Each square box framing a receptive field has a side of 23 degrees.

