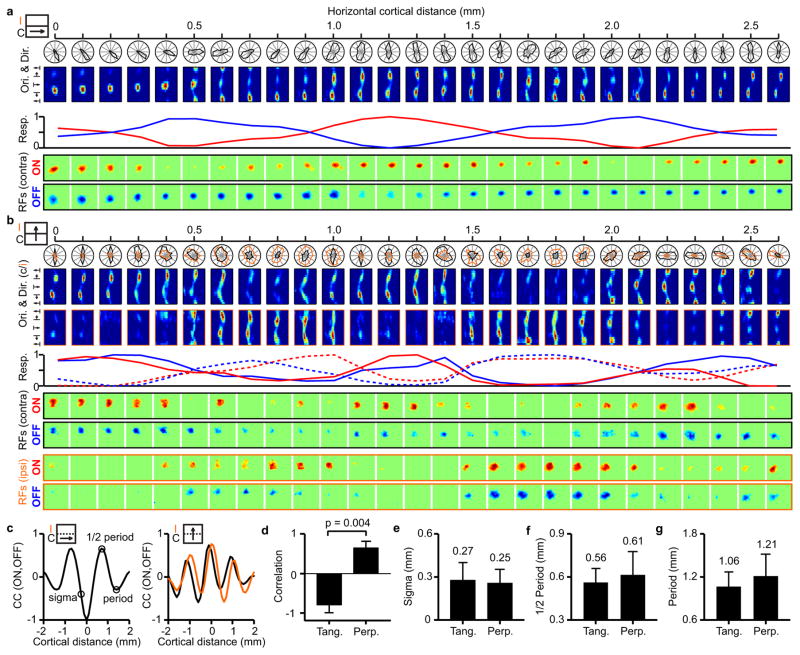
Figure 2. Topographic organization of ON and OFF cortical domains.
a, Example of a recording running parallel to an ocular dominance band. Icon on the left illustrates the recording (arrow) relative to the contralateral (C) and ipsilateral (I) bands. From top to bottom, the figure shows orientation tuning (polar and response plots), maximum ON (red) and OFF (blue) responses at each cortical site (line plot) and changes in ON and OFF receptive field position with cortical distance. b, Recording running perpendicular to ocular dominance bands (icon on the left) for contralateral (black) and ipsilateral (orange) eyes (continuous and dashed traces in line plots). c, Cross-correlation between ON and OFF response-profiles (red and blue lines in a and b) in penetrations tangential (left) and perpendicular to ocular-dominance bands (right). d, Average correlation between ON and OFF response profiles in tangential penetrations (n=5 penetrations, n=5 animals) and perpendicular penetrations (n=6 penetrations, n=4 animals). e–g, Averages for spatial scale, 1/2 period and full period of ON/OFF correlation (average differences are not significant). All error bars are standard deviations. Statistical comparisons made with two-sided Wilcoxon tests.

