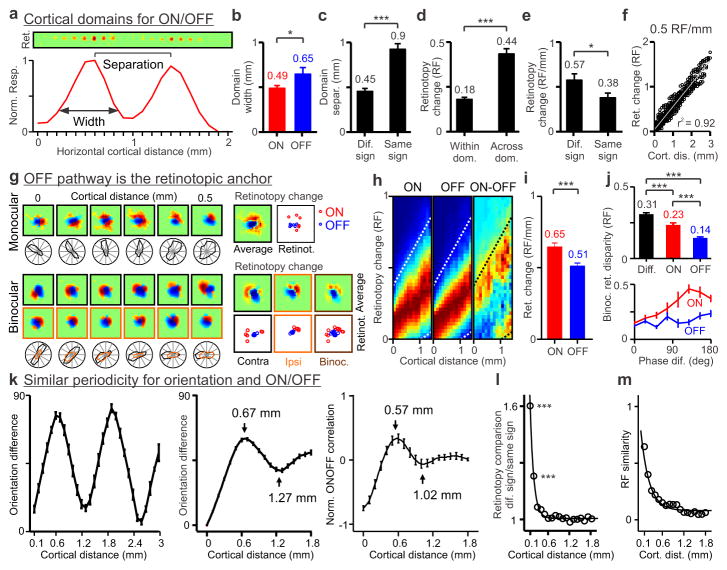
Figure 3. Cortical topographic relationships between ON/OFF, retinotopy and orientation preference.
a, Topography and retinotopy of two ON domains (receptive fields shown at the top). b, OFF domains (n=20 domains, n=12 animals) are wider than ON domains (n=24 domains, n=12 animals). c, Domains of same sign (n=16 domains, n=12 animals) are separated by twice the distance than domains of different sign (n=31 domains, n=12 animals). d, Retinotopy changes more across domains of same sign (n=65 domains, n=20 animals) than within domains (n=125 domains, n=20 animals). e, Retinotopy changes more between domains of different sign (n=31 pairs of domains, n=12 animals) than same sign (n=16 pairs of domains, n=12 animals). f, Example recording showing smooth changes in retinotopy with cortical distance at 0.5 RF/mm (n=496 paired comparisons, RF: receptive field). g, The OFF pathway anchors the cortical retinotopy of both monocular (top) and binocular receptive fields (bottom, contralateral: black: ipsilateral: orange). ON responses (red) rotate around OFF responses (blue), as illustrated by individual series of receptive fields (left), receptive fields averaged across cortical distance (Average) and retinotopy of strongest ON and OFF responses (Retinot.). h, Retinotopy changes with cortical distance for ON, OFF and ON-OFF responses (red: maximum, blue: minimum). Dotted lines show 20% of maximum ON responses (n=2,603 paired comparisons, n=8 animals). i, Retinotopy changes are more restricted for OFF than ON responses (n=962 ON and 962 OFF paired-comparisons, n=23 animals). j, Binocular retinal disparity is smallest when measured between OFF subregions (top, n=502 for ON-OFF, 251 for ON-ON and 251 for OFF-OFF subregions, n=28 animals). ON retinal disparity changes more with differences in spatial-phase than OFF (bottom). k, Periodicity in orientation preference across horizontal cortical distance within a single penetration (left) and across penetrations (middle, n=618 paired comparisons, n=37 animals). The orientation periodicity resembles the periodicity of the ON/OFF correlation (right, n=11 penetrations, n=8 animals). l, Retinotopy difference between subregions of different sign falls rapidly with cortical distance (n=13,416 paired comparisons, n=23 animals). m, Receptive field similarity also decays with cortical distance but at a slower rate (n=4,128 paired comparisons, n=23 animals). All error bars are standard errors. * p<0.05, *** p<0.0001 with two-sided Wilcoxon tests.

