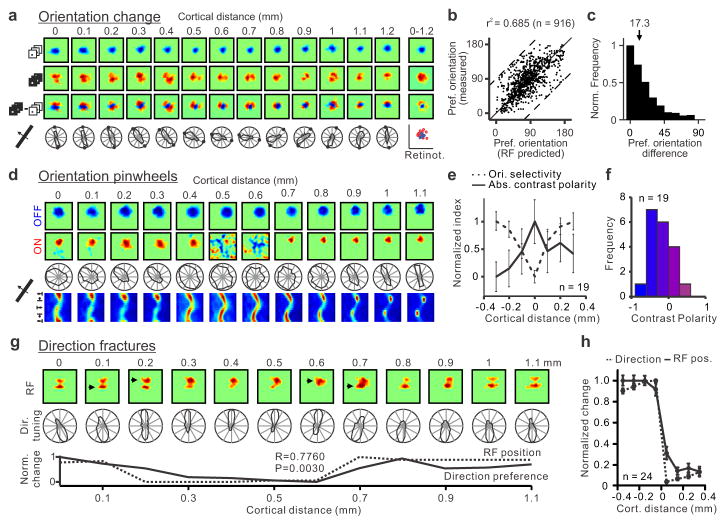
Figure 4. Changes in retinotopy explain changes in orientation and direction preference throughout the cortex.
a, Horizontal penetration showing a strong relationship between changes in ON/OFF retinotopy and orientation preference. Responses to light stimuli (middle) rotate around responses to dark stimuli (top) as seen in the dark-light difference (bottom). The orientation/direction tuning and ON/OFF retinotopy are shown below the color panels (small circles in polar plots are orientation predictions based on dark-light receptive fields). b, Predicted/measured comparisons in 109 penetrations (916 recording sites, n=26 animals) that passed our selection criteria (see methods; dashed lines mark maximum possible mismatch). c, Normalized count of differences between measurements and predictions (median: 17.3 degrees). d, Horizontal penetration passing through a pinwheel (at 0.5–0.6 mm) that was completely OFF dominated. e, Pinwheel centers (aligned at cortical distance zero) tended to have higher absolute contrast polarity (either strong OFF or ON dominance) than their cortical neighborhood (n=19 penetrations, n=13 animals; p<0.0001 for difference in orientation selectivity and p=0.039 for difference in absolute contrast polarity when comparing 0 and ± 0.3 mm, one-sided Wilcoxon tests). f, Histogram showing the contrast polarity of the 19 pinwheels from e. g, Horizontal penetration passing through regions with abrupt changes in direction preference (between 0.1 to 0.3 mm and 0.6 to 0.7 mm). Abrupt changes in direction were associated with abrupt changes in retinotopy (arrows at the top and line plots at the bottom). h, Aligning direction reversals at cortical distance zero (n=24 penetration sections, n=10 animals) revealed a strong association between direction and retinotopy changes (RF pos). All error bars are standard errors.

