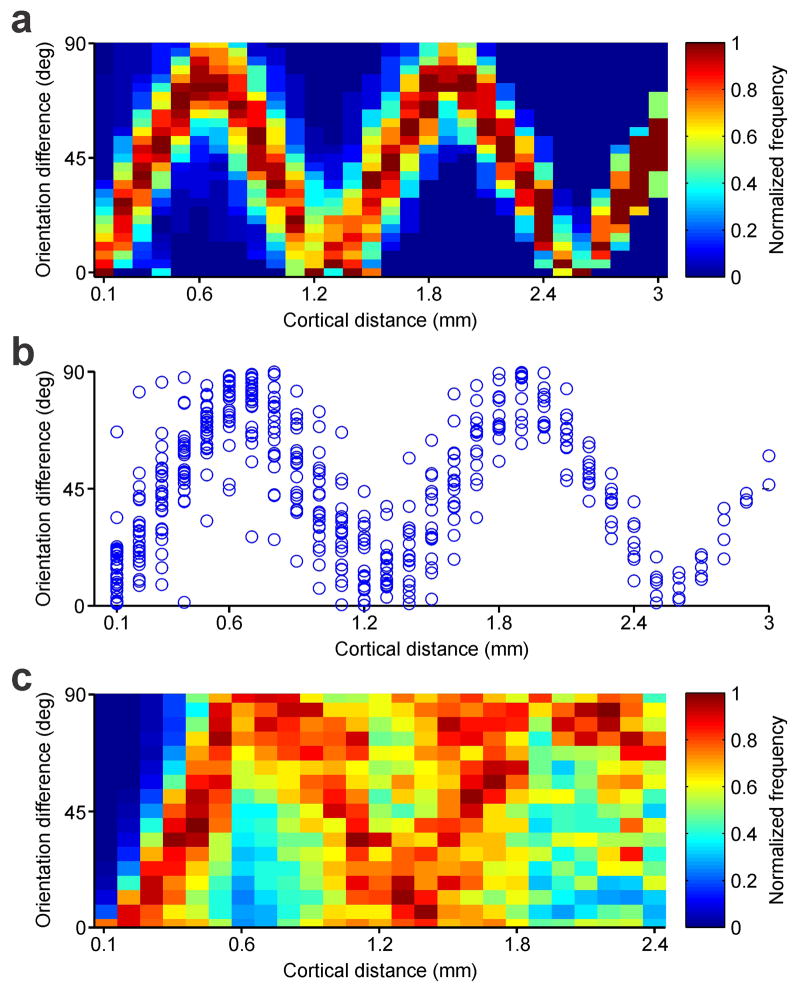
Extended Data Figure 4. Periodic changes in orientation preference.
a, Color map showing normalized frequency of orientation difference between paired recordings measured at different cortical distances within a single horizontal penetration (same as figure 3k left). b, Difference in orientation preference between all possible paired recordings measured within the same horizontal penetration as in a (n = 496 paired comparisons, n=1 animal). c, Same as a but for multiple recording sites obtained from multiple penetrations (n = 20,672 paired comparisons, n=36 animals).

