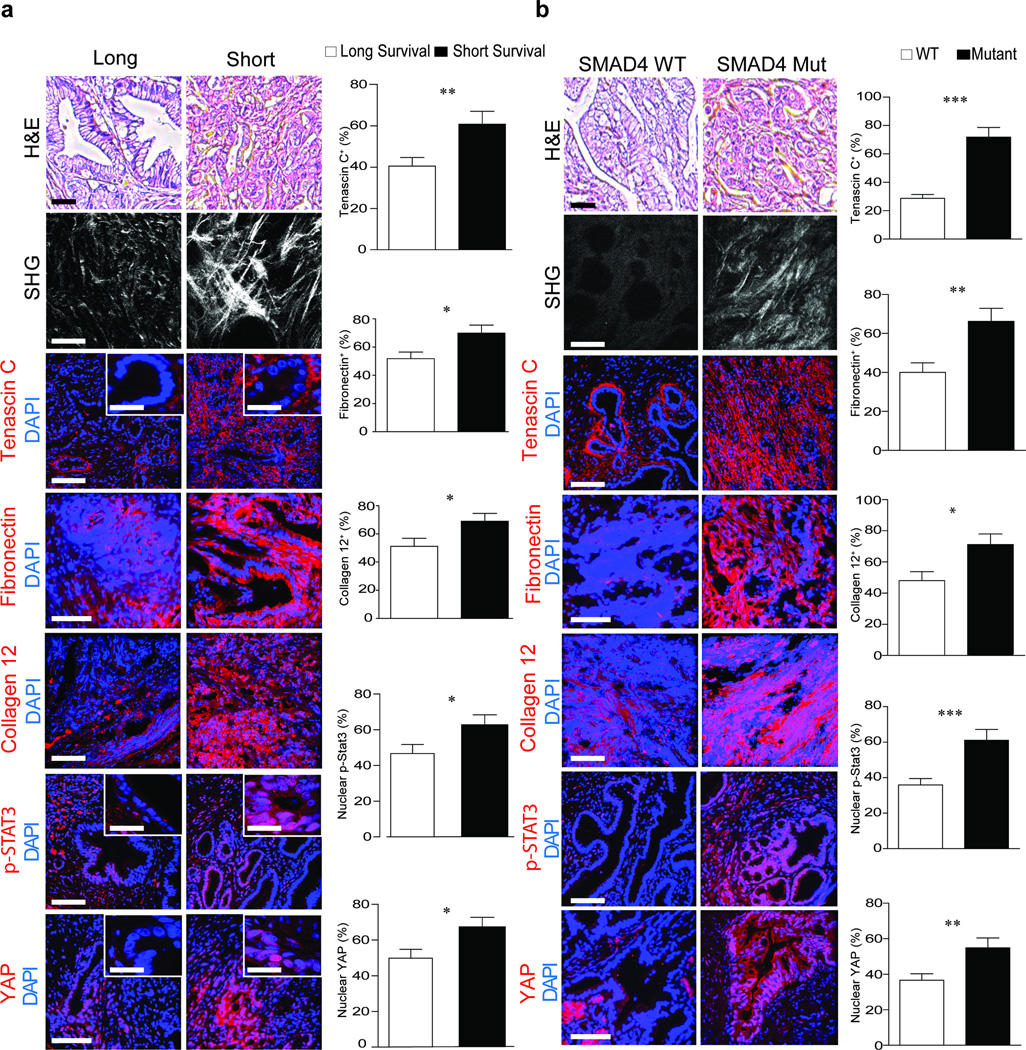
Figure 6. STAT3 enhances epithelial contractility to induce PDAC fibrosis and aggression.
(a) H&E images of PDAC tumors from patients with a median short survival of 11–289 days (n = 29) and median long survival of 1090–3298 days (n = 28). Scale bar, 100 µm. SHG images and quantification of extracellular collagen architecture in the pancreatic tissue around the epithelial ductal region in tissue described above. Scale bar, 75 µm (main). Immunofluorescence images and quantification of Tenascin C, Fibronectin, Collagen XII alpha1, p-STAT3, YAP1 and DAPI. Scale bar, 75 µm and 10 µm (insert). (b) H&E images of PDAC tumors from patients with WT SMAD4 (n = 10) or mutant SMAD4 (n = 10); Scale bar, 100 µm. SHG images and quantification of periductal collagen. Scale bar, 75 µm. Immunofluorescence images and quantification of Tenascin C, Fibronectin, Collagen XII alpha1, p-STAT3, YAP1 and DAPI. Scale bar, 75 µm. Results are presented as the mean +/− SEM. Subsequent statistical analysis was performed with unpaired two-sided student t-tests. (*P < 0.05; **P < 0.01, ***P < 0.001, ****P < 0.0001, “ns” not significant).

