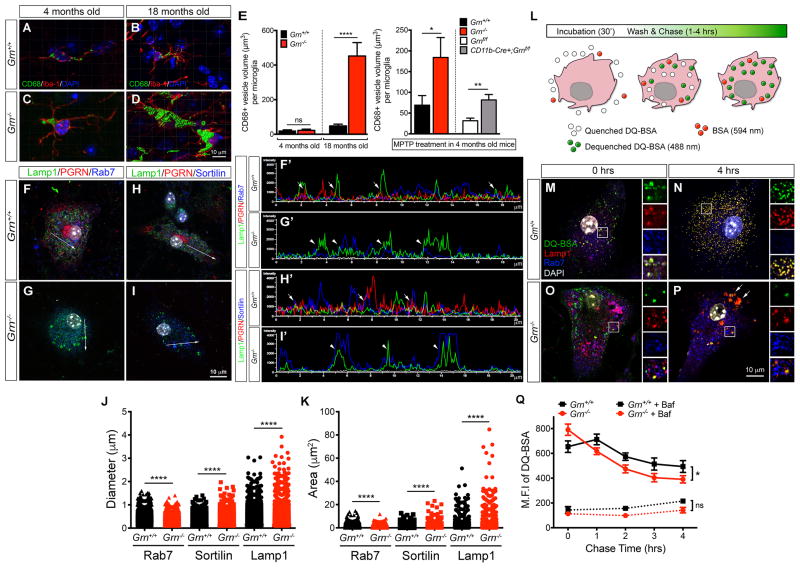
Figure 2. Lysosomal defects and increased complement production by Grn−/− microglia.
(A–D) Confocal images of Iba-1+ microglia from the ventral thalamus of 4 and 18 month old Grn+/+ and Grn−/− brains show CD68+ lysosomes in the cytoplasm. Images were captured from Grn+/+ and Grn−/− brains (n = 3 per age), and processed for 3D reconstruction of the lysosomes using Imaris software. (E) Quantification of CD68+ lysosome volume in the ventral thalamus of 4 and 18 month old Grn+/+ and Grn−/− mouse brains (left panel) and in 4 month old Grn+/+ and Grn−/− mouse brains after MPTP treatment (right panel). Volumes are expressed as μm3 per microglia. Student’s t test, n = 3 per group. * indicates p < 0.05, ** p < 0.01, and **** p < 0.001. (F–I) Confocal images of primary microglia cultured from neonatal Grn+/+ and Grn−/− mouse brains. Microglia are labeled with antibodies for Lamp1/PGRN/Rab7 or Lamp1/PGRN/Sortilin. Arrows indicate regions in each microglia where fluorescent signal intensity plots are obtained using Nikon NIS-Elements. (F′-I′) Fluorescent signal intensity plots of Lamp1+ (green), PGRN+ (red), Rab7+ (blue) and Sortilin+ (blue) vesicles in Grn+/+ and Grn−/− microglia. Arrows in F′ and H′ indicate partial overlap of Lamp1+;PGRN+ or PGRN+;Sortilin+ signals, respectively. (J–K) Quantification of the size of Lamp1+, Sortilin+ and Rab7+ vesicles in Grn+/+ and Grn−/− microglia. Student’s t test, **** indicates p < 0.001. (L) Diagram showing DQ-BSA assays in cultured microglia. Open circles are quenched DQ-BSA, green circles are dequenched DQ-BSA and red circles are BSA-conjugated with 568nm fluorophore. (M–P) Representative images of Grn+/+ and Grn−/− microglia after 30′ incubation with DQ-BSA (0 hrs) or 4 hrs after washing (4 hrs). Scale bar in P is 10 μm. Insets to the right of each panel represent enlarged images in the boxed area in M-P. Arrows in P indicate dequenched DQ-BSA signals in Lamp1+ lysosomes. (Q) Quantification of the maximal fluorescence intensity (M.F.I.) of dequenched DQ-BSA in Grn+/+ (n = 5) and Grn−/− microglia (n = 7). Bafilomycin inhibits lysosomal acidification and protein degradation in Grn+/+ and Grn−/− microglia. Two-way ANOVA, * indicates p < 0.05. See also Figure S2.

