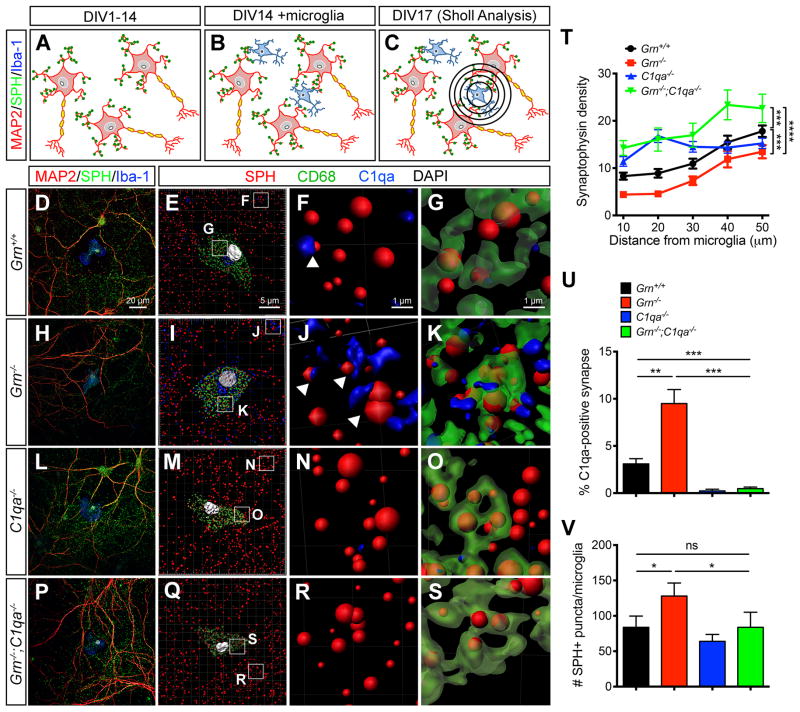
Figure 3. Increased synaptic pruning activity in Grn−/− microglia requires C1qa.
(AC) Diagrams showing microglia-neuron co-cultures and Sholl analyses to quantify synapses around microglia. (D–S) Confocal images showing the presence of synapses (SPH+) around Grn+/+, Grn−/−, C1qa−/− and Grn−/−;C1qa−/− microglia (Iba1+)(D, H, L, P). Imaris 3D image reconstruction of the microglia-neuron co-cultures at a lower magnification (E, I, M, Q). Higher magnification shows the presence of C1qa immediately adjacent synapses (F, J, N, R) and C1qa-tagged synapses inside CD68+ lysosomes in microglia (G, K, O, S). Scale bar 20 μm in D, 5 μm in E, and 1 μm in F and G. (T) Synaptic density around Grn+/+, Grn−/−, C1qa−/− and Grn−/−;C1qa−/− microglia. *** p < 0.005, **** p < 0.001, two-way ANOVA, n = 4 for all genotypes. (U–V) Quantification of the percentage of C1qa-tagged synapses outside microglia (U), and the number of SPH+ synapse inside microglia (V). * p < 0.05, ** p < 0.01, *** p < 0.005, Student’s t test, n = 4 per genotype. See also Figure S3.

