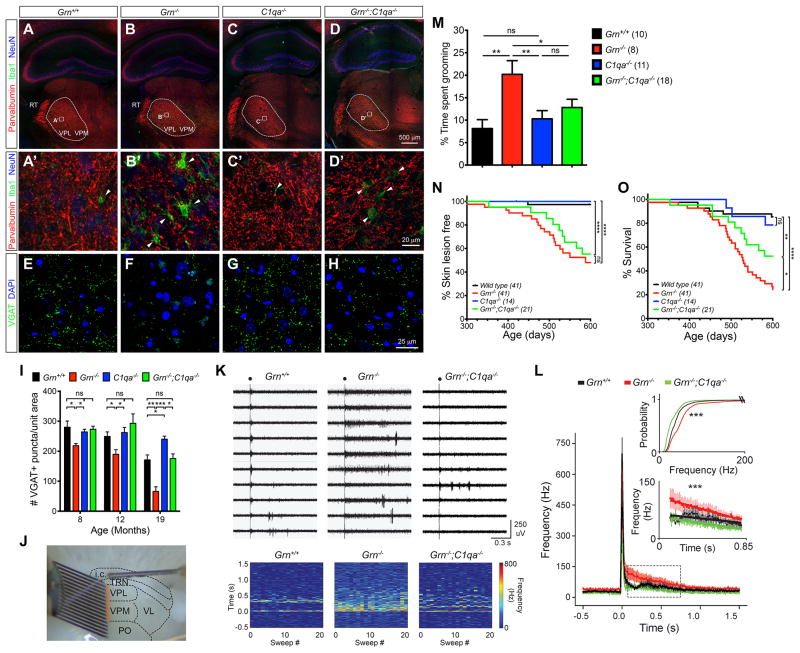
Figure 6. Removing C1qa in Grn−/−;C1qa−/− mice protects synaptic pruning, restores thalamic microcircuit function, mitigate OCD-like behaviors and improves survival.
(A–D) Confocal images of parvalbumin (Parv) show the projection of Parv+ neurons in the reticular nucleus (TRN) to the ventroposterior medial (VPM) and ventroposterior lateral (VPL) nuclei in the ventral thalamus of 12 month old Grn+/+, Grn−/−, C1qa−/− and Grn−/−;C1qa−/− mice. Dashed lines highlight VPM and VPL nuclei, and squares regions higher magnification in A′-D′. Scale bar is 500 μm in D, and 20 μm in D′. (E–H) Confocal images of VGAT+ synapses in the ventral thalamus in 19 month old Grn+/+, Grn−/−, C1qa−/− and Grn−/−;C1qa−/− mice. Scale bar is 25 μm in H. (I) Quantification of VGAT+ synaptic density in the ventral thalamus of 8, 12 and 19 month old Grn+/+, Grn−/−, C1qa−/− and Grn−/−;C1qa−/− mice. Student’s t test, * indicates p < 0.05, ** p < 0.01 and ns, not significant. (J) Image of a thalamic slice showing the stimulating electrode in the internal capsule and the 16-channel linear array silicon probe that records multiunit firing in VPM and VPL. (K) Representative multiunit recordings (orange box in J) from the ventral thalamus of Grn+/+, Grn−/− and Grn−/−;C1qa−/− mice. Black circle indicates stimulation artifact. Bottom, rate meters showing consistent evoked spike rate across sweeps of stimulations (X-axis) relative to time (Y-axis). (L) Peri-stimulus time histogram of the population data from 6 Grn+/+, 7 Grn−/− and 4 Grn−/−;C1qa−/− mice. Inset bottom: enlargement of the black dashed box in (L) showing the slope of the response is significantly different among genotypes (***, p < 0.0001, F = 10.5554). Inset top: plot of the relative probability of eliciting AP firing frequencies among Grn+/+, Grn−/−, and Grn−/−;C1qa−/− mice analyzed by the Kolmogorav-Smirnov Test (Grn+/+ vs. Grn−/−, *** p < 0.0001, D = 0.5783; Grn+/+ vs. Grn−/−;C1qa−/−, *** p < 0.0001, D = 0.4980; Grn−/− vs. Grn−/−;C1qa−/−, *** p < 0.0001, D = 0.7751). Error bars, s.e.m., (M) Grooming activities in Grn+/+, Grn−/−, C1qa−/− and Grn−/−;C1qa−/− mice is expressed as percentage of total time. * p < 0.05, ** p < 0.01, ns, not significant, Student’s t test. (N–O) Kaplan-Meier curve for skin lesion onset and survival in Grn+/+, Grn−/−, C1qa−/− and Grn−/−;C1qa−/− mice. * p < 0.05, **** p < 0.001, ns, not significant, Long-rank (Mantel-Cox) test. See also Figures S4, S5 and S6, and Supplemental Movie S1.

