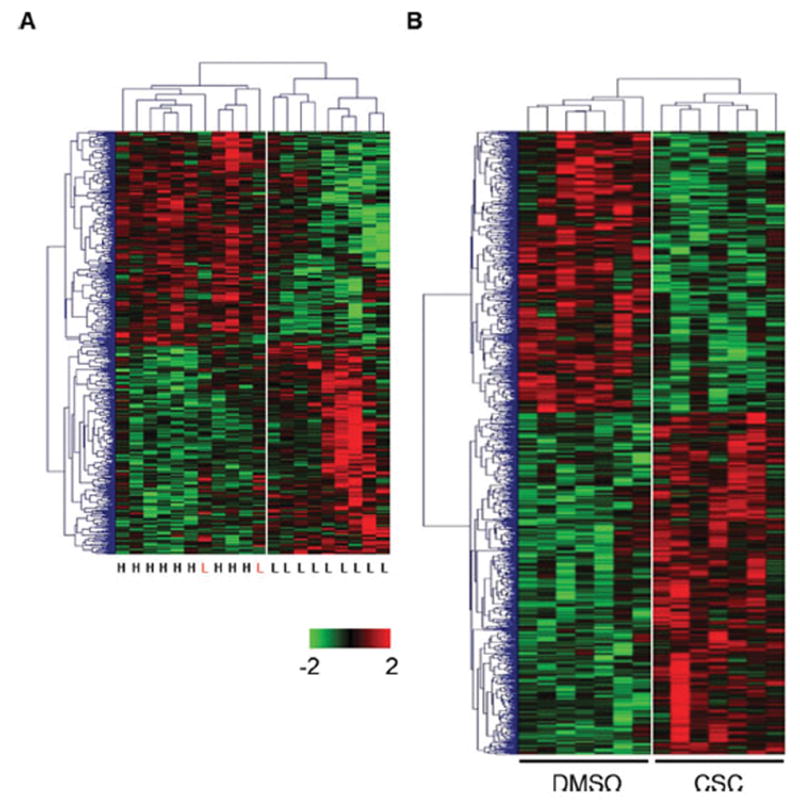
Figure 3.

Hierarchical clustering of significant differentially expressed genes in in vitro and in vivo. (A) 310 up-regulated and 304 down-regulated genes in heavy (labeled with H) versus light (labeled with L) smokers. (B) 647 up-regulated and 531 down-regulated genes in CSC versus DMSO treated PBMCs. The dendrogram on the top shows correlations between subjects, and on the left shows correlations between genes. Red, up-regulation; green, down-regulation.
