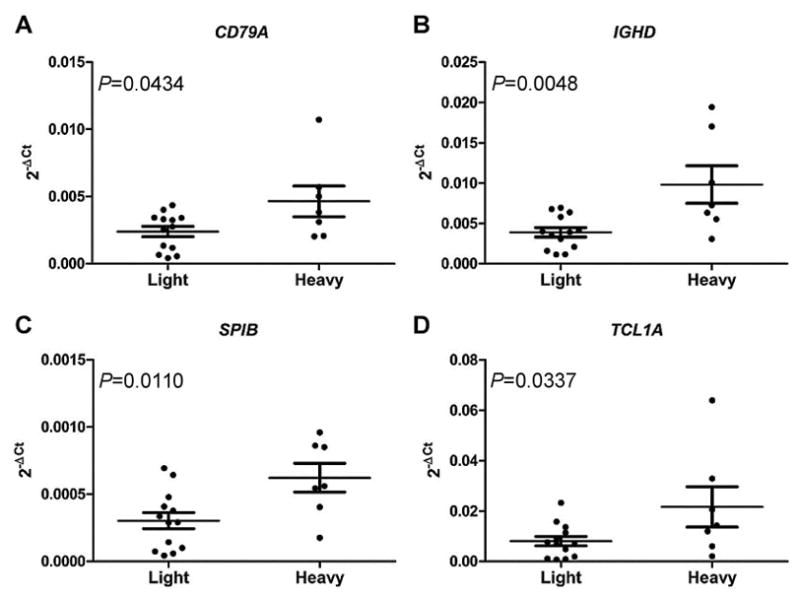
Figure 4.

Expression levels of four significant genes between light smokers and heavy smokers. Gene expression was measured through RT-qPCR on 13 PBMCs from light smokers and seven PBMCs from heavy smokers. Expression levels are shown in 2−ΔCt on the Y-axis, smoking status is shown on the X-axis. The data are expressed as mean ± SEM. The P value of each gene is shown. (A) CD79A, (B) IGHD, (C) SPIB, and (D) TCL1A.
