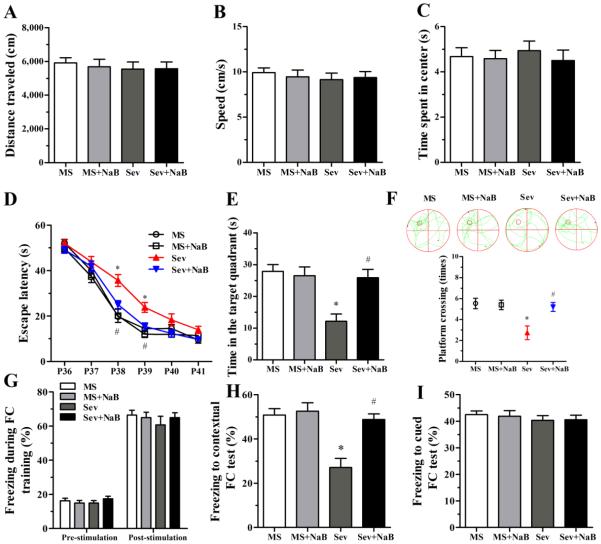
Fig. 2.
Effects of neonatal exposure to sevoflurane on behavior of rats in the open field (OF), Morris water maze (MWM), and fear conditioning (FC) tests. (A-C) Histograms showing distance traveled, speed, and time spent in center during the OF test. (D) Plots showing escape latency during the MWM training. (*P < 0.001 vs. the MS group; #P = 0.007 vs. the Sev group; P39: *P < 0.001 vs. the MS group; #P = 0.018 vs. the Sev group). (E) Histogram showing time spent in the target quadrant during the MWM test (*P < 0.001 vs. the MS group; #P = 0.001 vs. the Sev group). (F) Swimming tracks and plots showing rats crossing the escape platform during the MWM test (*P = 0.002 vs. the MS group; #P = 0.007 vs. the Sev group). (G) Histograms showing the percent of freezing during the FC training session. (H) Histograms showing the percent of freezing during the contextual FC test (*P < 0.001 vs. the MS group; #P < 0.001 vs. the Sev group). (I) Histograms showing the percent of freezing during the cued FC test. n = 15 per treatment group. MS: maternal separation; Sev: sevoflurane.

