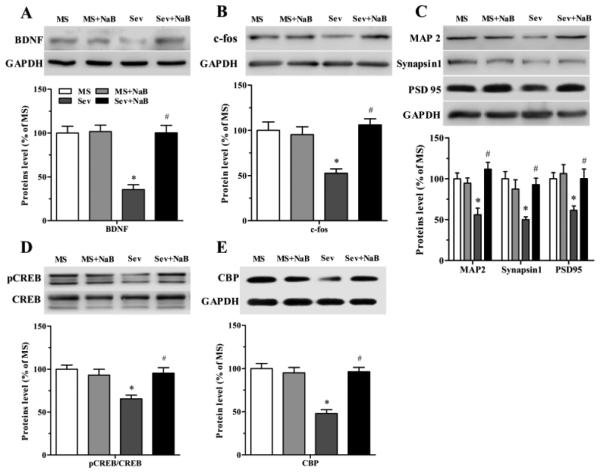
Fig. 9.
Effects of neonatal exposure to sevoflurane and sodium butyrate (NaB) treatment on expression of hippocampal proteins. (A) (A, top) Representative Western blot images of brain-derived neurotrophic factor (BDNF) and GADPH blots in the hippocampal tissue of rats from four treatment groups. (A, bottom) Histograms showing results of the densitometric analysis of BDNF in the hippocampal tissue from four treatment groups. Densities of BDNF blots in the MS group were taken as 100%. *P < 0.001 vs. the MS group; #P < 0.001 vs. the Sev group. (B) Western blot data for c-fos in the hippocampal tissue from four treatment groups presented as in (A). *P = 0.012 vs. the MS group; #P = 0.001 vs. the Sev group. (C) Western blot data for microtubule-associated protein 2 (MAP2), synapsin 1, and PSD 95 in the hippocampal tissue from four treatment groups presented as in (A). MAP2: *P = 0.004 vs. the MS group; #P < 0.001 vs. the Sev group. Synapsin 1: *P = 0.004 vs. the MS group; #P = 0.0012 vs. the Sev group. PSD95: *P = 0.043 vs. the MS group; #P = 0.042 vs. the Sev group. (D) Western blot data for pCREB/CREB in the hippocampal tissue from four treatment groups presented as in (A). *P = 0.002 vs. the MS group; #P = 0.008 vs. the Sev group (E) Western blot data for CBP in the hippocampal tissue from four treatment groups presented as in (A). *P < 0.001 vs. the MS group; #P < 0.001 vs. the Sev group. n = 5 per treatment group. MS: maternal separation; Sev: sevoflurane.

