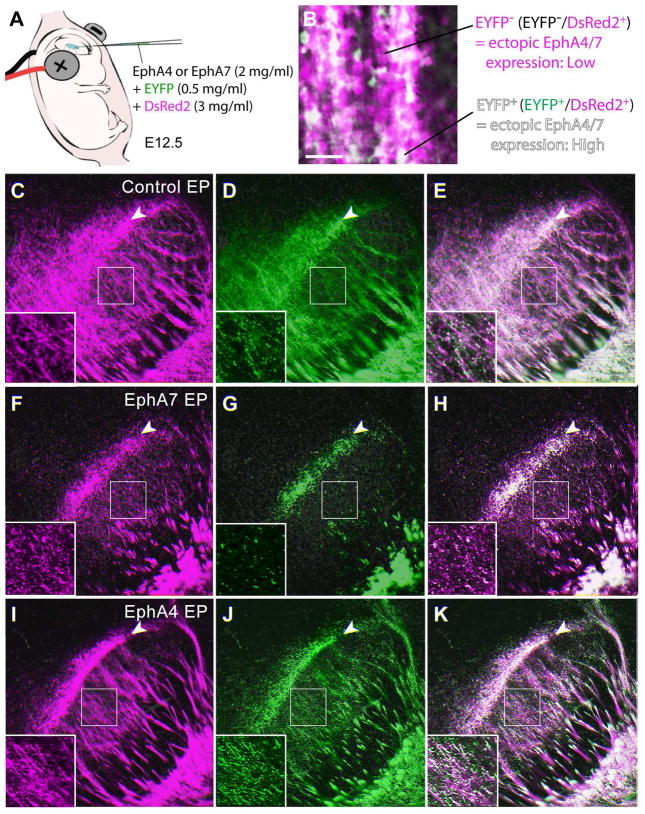
Figure 6. Overexpression of EphA4 in the somatosensory cortex does not result in a shift of CT projections in the VB/POm at P4.
(A) Schema for in utero electroporation with two fluorescent markers at different concentrations. The control, EphA4-, or EphA7-expression plasmid together with 0.5 mg/ml (low concentration) of EYFP-expression plasmid and 3 mg/ml (high concentration) of DsRed2-expression plasmid was injected into the lateral ventricle of E12.5 brains, followed by electroporation. (B) P4 cortical neurons in the somatosensory cortex electroporated with low concentration of EYFP (green) and high concentration of DsRed2 (magenta). EYFP+ cells (white; EYFP+/DsRed2+) displays neurons with higher levels of ectopic EphA expression, while EYFP− cells (magenta; EYFP−/DsRed2+) shows cells with lower levels of ectopic EphA expression. (C–E) The VB/POm of control electroporated (EP) brains. EYFP+ and EYFP− CT axons are distributed similarly in the center of the VB (insets show higher magnification views of the boxed areas) as well as at the border region between the VB and POm (arrowheads). (F–H) The VB/POm of EphA7 electroporated brain. CT axons with high levels of EphA7 expression (EYFP+) show a restricted distribution at the border region between the VB and POm (arrowheads) and are segregated from axons with low levels of ectopic EphA7 expression (EYFP−) that distribute also in the body of the VB (insets show higher magnification views of the boxed areas). (I–K) The VB/POm of EphA4 electroporated brain. Unlike EphA7 overexpression, EphA4 has no effect on CT axons in this region similar to that of controls, with high (EYFP+) and low (EYFP−) levels of expression distributed similarly at the VB and POm (insets show higher magnification views of the boxed areas). Scale bar = 100 μm (for B), 200 μm (for C–K).

