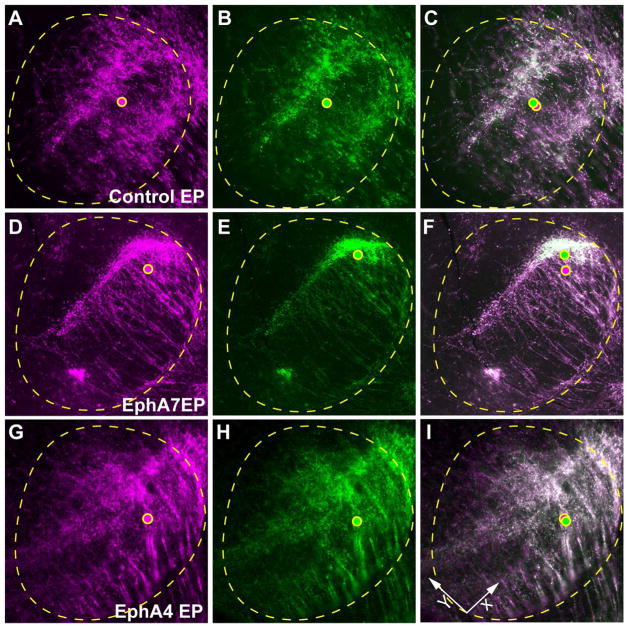
Figure 7. Centroid analysis of control, EphA7- and EphA4-overexpressing CT projections within the VB.
(A–C) The VB/POm of control electroporated brains. The centroids of the area covered by DsRed2+ and EYFP+ CT axons (dots in magenta and green, respectively) are closely positioned. (D–F) The VB/POm of EphA7 electroporated brains. The centroid of EYFP+ CT axons are shifted dorsally from that of DsRed2+ CT axons compared to controls. (G–I) The VB/POm of EphA4 electroporated brains. The centroids of DsRed2+ and EYFP+ CT axons are closely positioned.

