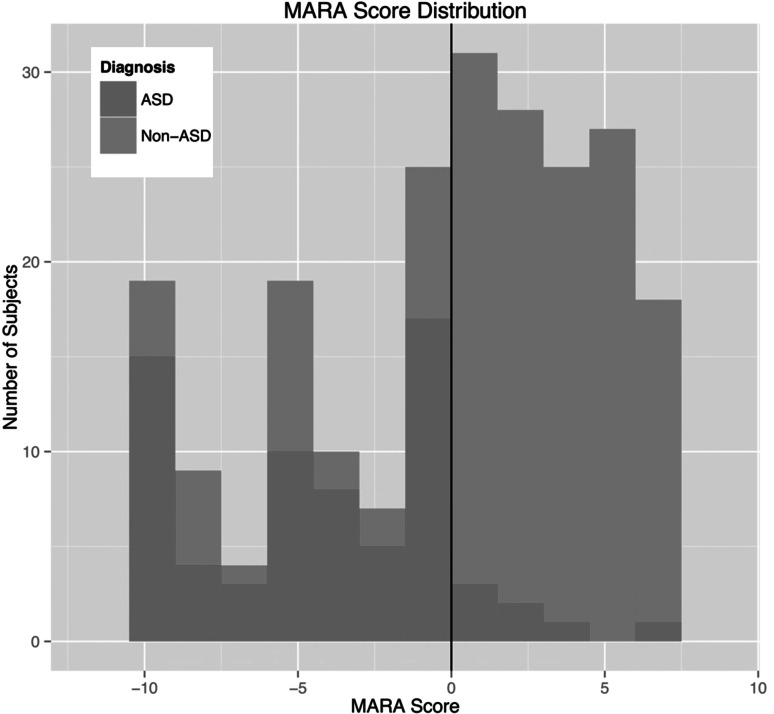
Fig. 3.
MARA score distribution. This histogram shows the distribution of MARA scores for those with ASD compared to those without ASD. The line at 0 represents the classification cutoff for the MARA algorithm—individuals with a MARA score <0 are classified as ASD and individuals with a MARA score >0 are classified as non-ASD using this screener

