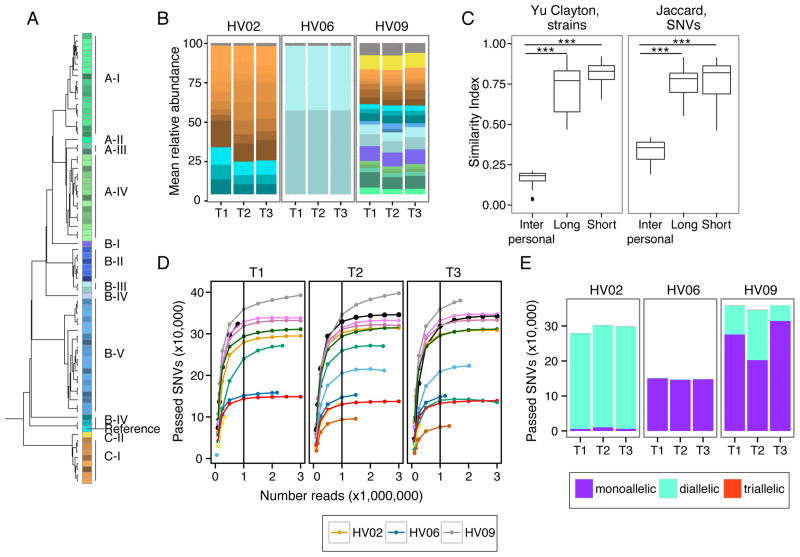
Figure 5. Individual Specific Strain and SNV Signatures are Stable Over Time.
(A) Dendrogram of P. acnes strain genome similarity based on core SNVs. (B) P. acnes strain relative abundance plots of 3 representative individuals’ manubrium, colors as in (A). Full set of strain classifications is shown in Figure S6B. (C) Boxplots of Yue-Clayton (left) and Jaccard (right) theta indices indicate similarity between strains (all body sites) and SNVs (manubrium and back) of P. acnes in a time series (θ = 1 is identical). ***P < .001 value, Wilcoxon rank-sum test. (D) Rarefaction curves demonstrate core SNV accumulation with read subsampling for manubrium sites. For remaining panels, SNVs are reported for samples subsampled to 1 million reads. Colors correspond to individuals as shown in Figure S1B. (D) Number of SNVs that are mono, di, and triallelic. T1, T2, and T3 indicate order in time series. HV is healthy volunteer. See also Figure S4.

