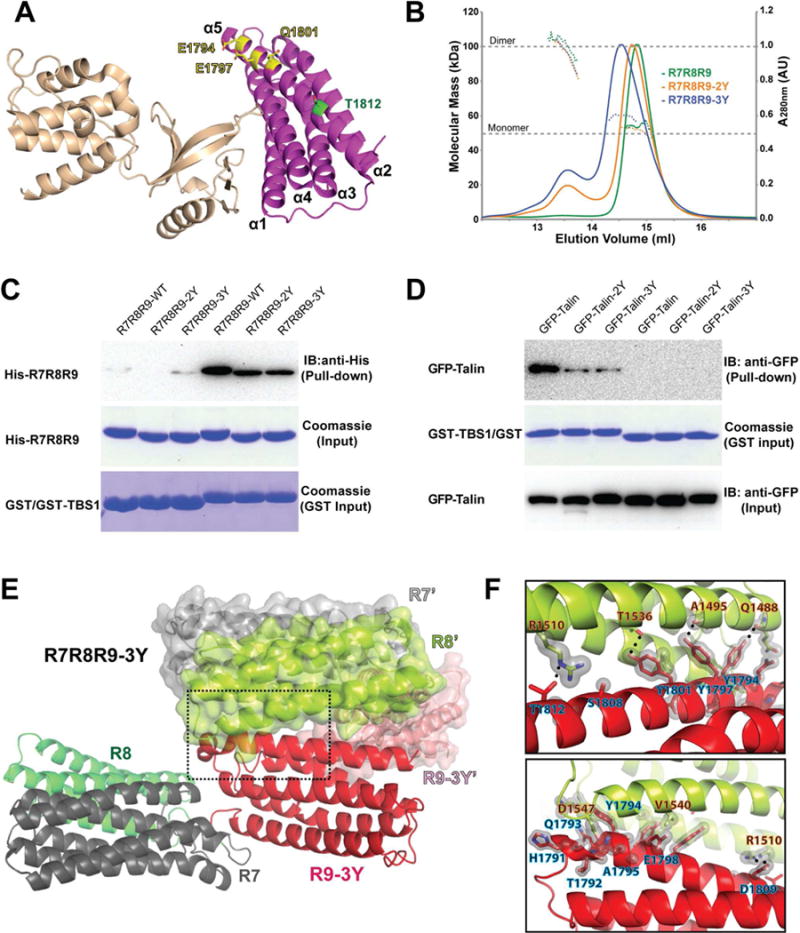
Figure 2. Mutations enhance the R7R8R9 dimerization.

(A) Cartoon diagram of the F2F3:R9 complex structure. The side chain configurations of Glu1794, Glu1797, Gln1801 (yellow) and Thr1812 (green) are shown in stick. (B) UV traces from the HPLC elution for R7R8R9 (green), R7R8R9-2Y (orange), and R7R8R9-3Y (blue) are shown as colored solid lines with the scale shown on the right side. The MALS-derived molecular mass distribution are plotted as dotted lines in the colors corresponding to the UV traces, with the scale shown on the left side. The dashed lines at 50 kDa and 100 kDa indicate the molecular mass of the monomer and dimer forms of R7R8R9, respectively. (C) In vitro pull-down of His-tagged R7R8R9, -2Y and -3Y mutants by GST-TBS1. His-tagged proteins in the pull-down samples were detected by Western blot using anti-His antibody. Input samples of His-R7R8R9 and GST/GST-TBS1 were determined by Coomassie staining. (D) Pull-down of full-length GFP-talin and mutants expressed in HEK293T cells by purified GST-TBS1. Pull-down and input of GFP-talin were detected by Western blot using anti-GFP antibody. The input of GST-TBS1 was determined by Coomassie staining. (E) Cartoon representation of the R7R8R9-3Y crystal structure. Each domain is colored and labeled. A symmetrically related R7R8R9-3Y molecule is shown in surface/cartoon representation. The interface formed by the R9-3Y and R8’ domains is indicated by the dashed box. (F) Close-up views of the box in (E). Hydrogen bonds are denoted by a dotted line, and van der Waals contacts are represented by a light gray surface. Interacting residues are labeled (R8’ in orange-black text and R9 in blue-black text).
See also: Figure S1.
