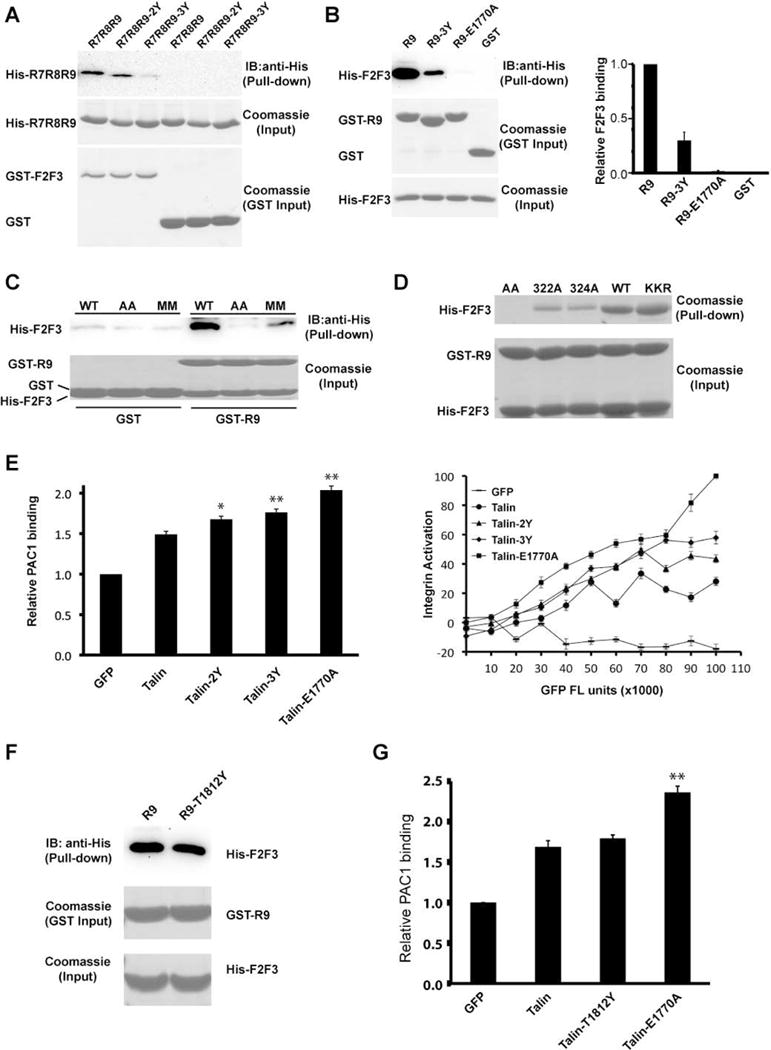
Figure 3. Additional F3:R9 interaction site.

(A) In vitro pull-down of His-tagged R7R8R9 and mutants by GST-F2F3. Bound R7R8R9 was detected by Western blot using anti-His antibody. All input samples were examined by Coomassie staining for equal loading. (B) Left: in vitro pull-down of His-tagged F2F3 by GST-R9 and mutants. Bound F2F3 was detected by Western blot using an anti-His antibody. GST/GST-R9 pull-down and His-F2F3 input were shown by Coomassie staining. Right: the intensity of each band derived by Western blot was quantified by ImageJ software and shown in histogram. The F2F3 binding to wild-type R9 was defined as 1 and data are shown as the means ± SD from three experiments. (C) In-vitro pull-down of His-F2F3 and two double mutants (AA: K322A/K324A; MM: K322M/K324M) by GST-R9. Bound F2F3 was detected by Western blot using anti-His antibody. His-F2F3 input and GST/GST-R9 pull-down were shown by Coomassie staining. (D) In-vitro pull-down of His-F2F3 and its assorted mutants by GST-R9. His-F2F3 input and GST/GST-R9 pull-down were shown by Coomassie staining. (E) Integrin activity analyses of various talin mutants. CHO-A5 cells were transfected with GFP empty vector or GFP-talin and mutants. αIIbβ3 integrin activity was determined by PAC-1 antibody and FACS analysis. Left: histogram of relative PAC1 binding. PAC-1 binding of GFP transfected cells was defined as 1. Right: dose-dependent analysis of integrin activation. The relative PAC1 binding was plotted against GFP fluorescence intensity (FL unit) that indicates the expression level of each GFP-tagged talin construct. The PAC1 binding of talin-E1770A with maximal FL unit was defined as 100% and the fluorescence intensity of E1770A at minimal expression level was defined as 0%. *: P< 0.05, **: P< 0.01 compared with GFP-talin. All integrin activity data were represented by means ± SD, n=3. (F) Comparison of in vitro pull-down of His-F2F3 by GST-R9 and GST-R9-T1812Y. (G) The integrin activity of the cells transfected with various talin constructs was detected as described in (E). NS: not significant compared with GFP-talin.
See also: Figures S2 and S4.
