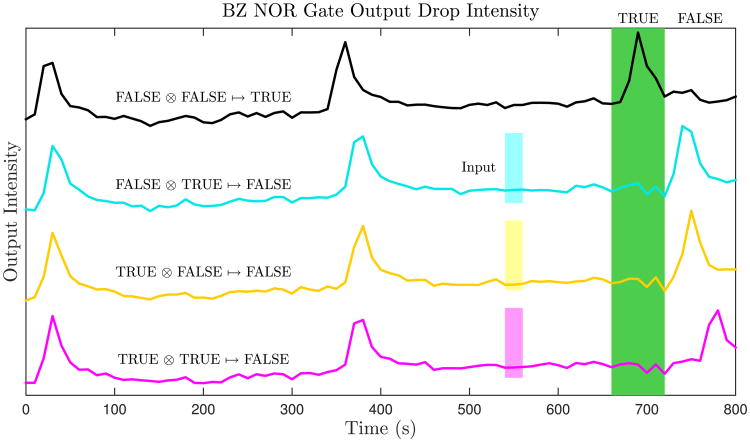
Fig. 3.
Experimental traces of the intensity of the output droplets of four NOR gates measured over time in experiment. Each trace corresponds to a NOR gate with a different input configuration. The three small colored boxes indicate when the input is received by way of perturbation from a neighboring input droplet. The large green box represents the reading frame of each gate. If the output droplet spikes within the reading frame then the output of that gate is TRUE; otherwise it is FALSE. As expected for a NOR gate, the FALSE ⊗ FALSE input results in a TRUE output, and all other input combinations result in a FALSE output. A movie of each of the four cases is shown in the Appendix B.

