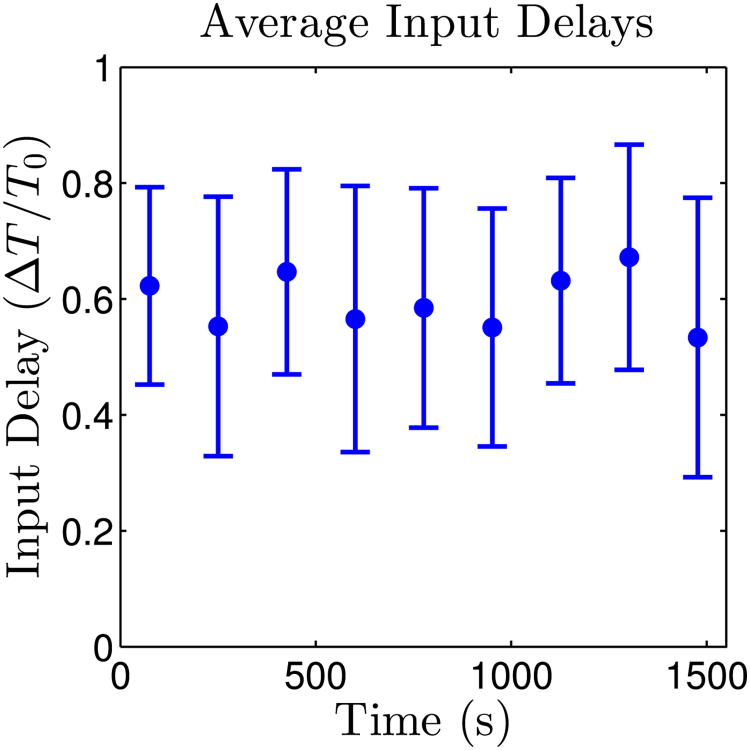
Fig. 5.
Average amount of time until an input spikes after light is removed, normalized by the natural period, as a function of time since the start of the experiment. The delay stays relatively constant throughout the experiment. Approximately 20 measurements were performed for each data point. Error bars mark one standard deviation above and below the mean phase response.

